


If you have ever tried to speed up a slow query, someone has probably told you to “just check the execution plan.” Sound advice, but if you have never read one before, the output can look like an alien language. This article breaks down what execution plans are, how to make sense of them, and how modern tooling can take much of the pain out of the process.
What Is a Query Execution Plan?
When you run a SQL query, your database doesn't simply leap into action and start scanning tables at random. Instead, the query optimizer - a component built into every major database engine - evaluates dozens or even hundreds of possible strategies for retrieving your data, estimates the cost of each, and settles on the one it evaluates to be fastest. The execution plan is the database's written record of that decision.
It's not unlike a GPS route. If you asked to get from A to B, the GPS would work out the best sequence of roads to take; the turn-by-turn directions it hands you are the plan. Understanding that plan tells you whether you are on a highway or a dirt track, and more importantly, where the bottlenecks are.
How to Generate an Execution Plan
In most databases, you generate a plan by prefixing your query with the EXPLAIN keyword. MySQL, PostgreSQL, MariaDB, and SQLite all support this syntax, while SQL Server uses SET SHOWPLAN_ALL ON or the graphical execution plan button in its tooling. The output varies by database, but the underlying concepts are consistent across all of them.
For example, running EXPLAIN SELECT * FROM orders WHERE customer_id = 42 will not actually execute the query. Rather, it will return a description of how the database intends to execute it. You can then use that description to decide whether any optimization is needed.
The Key Things to Look For
Execution plans can be intimidating at first because they expose a lot of information at once. Fortunately, most performance problems show up through a handful of tell-tale signs:
The first thing to look for is a full table scan, often labeled as ALL in MySQL or Seq Scan in PostgreSQL. This means the database is reading every single row in a table to find the ones it needs - the equivalent of searching an entire library book by book rather than using the catalog. On small tables this is harmless, but on large ones it is almost always a problem.
Next, pay attention to estimated row counts. The optimizer's estimates drive its decisions, so when the estimate is wildly off from reality, the plan it chooses may be inefficient. A large discrepancy usually points to stale statistics, which you can fix by running an ANALYZE or UPDATE STATISTICS command depending on your database.
Finally, look at join types. Nested loop joins work well when one side of the join is small, while hash joins are better for larger datasets. If the plan is choosing a nested loop across two large tables, adding an appropriate index or restructuring the query may convince the optimizer to use a more efficient strategy.
Navicat's Visual Explain Feature
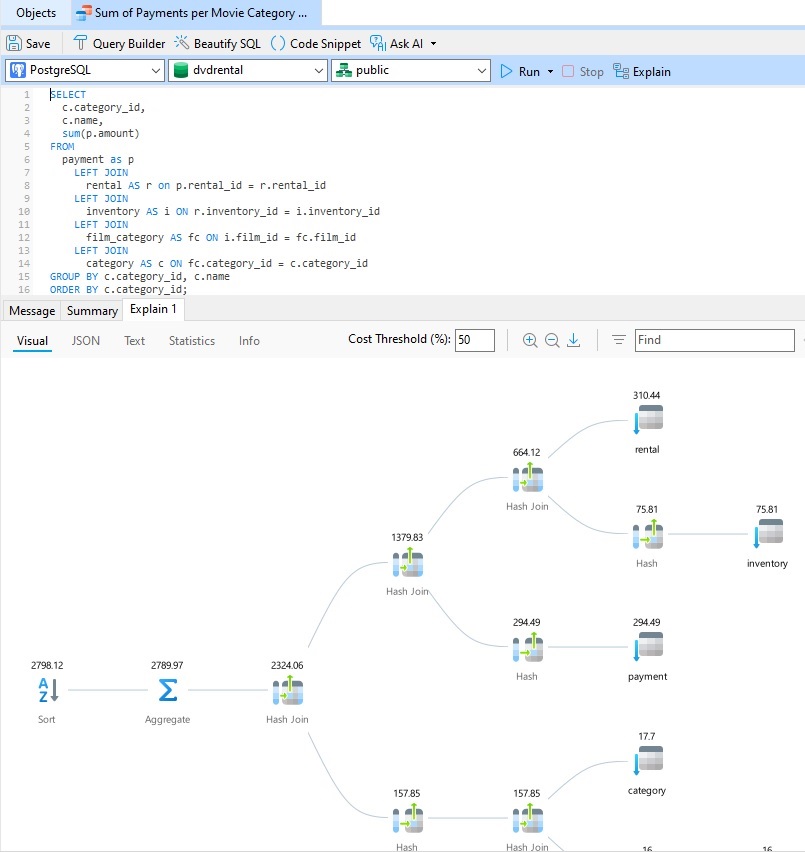
Reading raw EXPLAIN output as plain text requires practice and patience. Navicat 17 addresses this with a significantly enhanced Visual Explain feature that transforms execution plan data into a graphical representation, making it far easier to absorb at a glance.
Rather than parsing rows of text, you see the execution plan rendered as a visual flow, with each operation displayed as a node. Navicat highlights costly or inefficient operations, so your eye is immediately drawn to the parts of the plan that deserve attention - no mental arithmetic required! For those who prefer to work with raw data, Navicat also presents the same plan in multiple formats: visual, JSON, text, and statistical views are all available, so you can switch between them depending on what you need to see.
This multi-format approach is particularly useful when you are working across different database platforms, since each engine formats its EXPLAIN output differently. Navicat normalizes the experience so that whether you are working with MySQL, PostgreSQL, or another supported database, the workflow for examining execution plans remains consistent.
A Practical Approach to Plan Analysis
The best way to build confidence with execution plans is to start with a query you already understand, generate its plan, and then trace through it step by step. Add an index and run EXPLAIN again. You will see the plan change in real time, which builds an intuitive feel for how the optimizer responds to schema changes.
Over time, spotting a full table scan or a bad row estimate becomes second nature. The execution plan stops feeling like a cryptic dump of internals and starts feeling like exactly what it is: a clear explanation of what your database is doing and why.
Conclusion
Execution plans are one of the most powerful tools in a developer or DBA's performance toolkit - and they are far more approachable than they first appear. Once you know what a full table scan looks like, what a row count estimate means, and how join types differ, you have most of what you need to diagnose the majority of query performance issues. Pair that knowledge with a visual tool like Navicat's built-in explain visualization, and you can move from confusion to confident diagnosis in far less time than you might expect.