

The Query Analyzer Section
Navicat Monitor for MySQL/MariaDB's Query Analyzer tool provides a graphical representation of the query logs that makes interpreting their contents much easier. In addition, the Query Analyzer tool enables you to monitor and optimize query performance, visualize query activity statistics, analyze SQL statements, as well as quickly identify and resolve long running queries. Last week's blog provided an overview of this useful feature and described how to take full advantage of the Latest Deadlock Query and Process List screen sections. In this 2nd and final installment, we will learn all about the Query Analyzer screen section.
How it Works
The Query Analyzer collects information about query statements using one of the following three methods:
- Retrieve the General Query Log from the server and analyze its information.
- Retrieve the Slow Query Log from the server and analyze its information.
- Query the performance_schema database and analyze it for specific performance information.
With regards to the Performance Schema, it was introduced in MySQL Server 5.5.3. It normalizes Query statements and truncates them to a length of 1024 bytes. Moreover, similar queries whose only difference are the literal values are combined. Finally, quoted values and numbers are replaced by a question mark (?).
You'll find the Query Analyzer section below the Latest Deadlock Query and Process List sections that we covered last week:
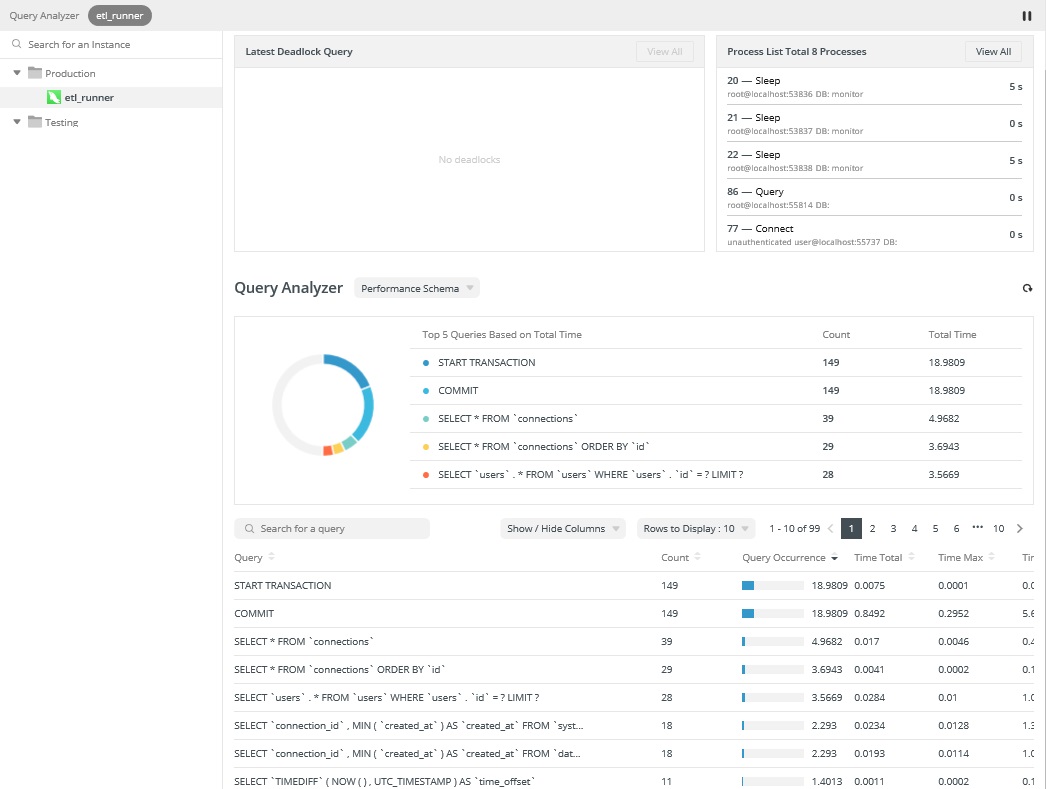
The Query Analyzer section is itself divided into two subsections: Top 5 Queries and Query Table. We'll look at those now.
Top 5 Queries
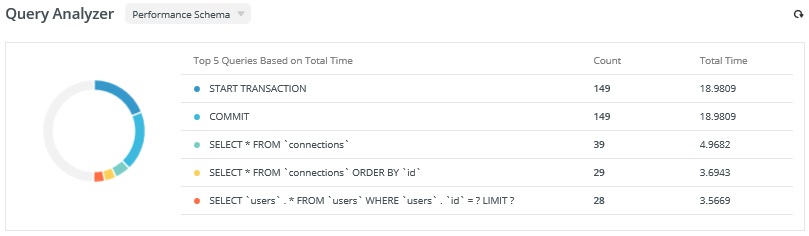
This section shows the top 5 most time-consuming queries, along with a color-coded donut chart that gives you an immediate snapshot of potential issues. You can click the refresh button at any time to update the top 5 queries list.
The Top 5 Queries section contains the following fields:
- Top 5 Queries Based on Total Time: The query statement.
- Count: The number of times that the query has been executed.
- Total Time: The cumulative execution time for all the executions of the query.
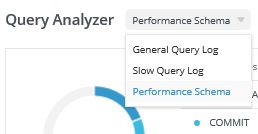
The source of the query data is shown in a dropdown list next to the section title. You can select another source by choosing it from the list.
Query Table
The query table provides the summary information for all executed queries. Calculated statistics include a Count, Query Occurrence, Time total, and many others.
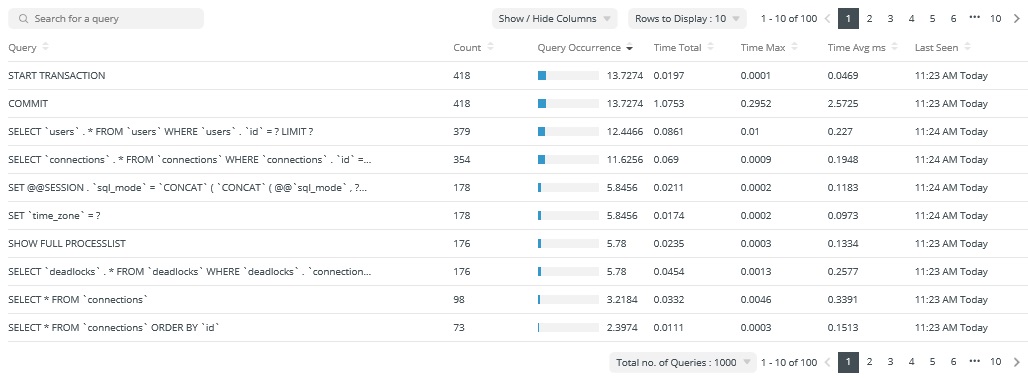
It boasts many useful features:
- You can hover over a query to show the full query statement and click "Copy Query" to copy it.

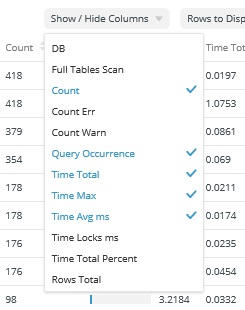
- Click "Show / Hide Columns" and select the columns that you want to hide. Select "Restore Default" to restore the table to its default settings.
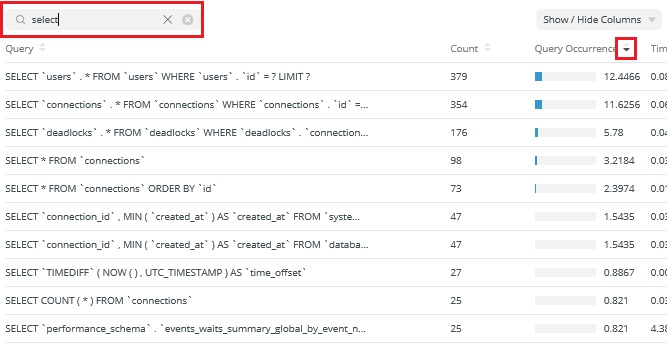
- Queries can be filtered and sorted. Simply enter a search string in the Search for a query box to filter the table and click the column name to sort the table.
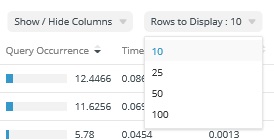
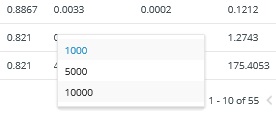
- To change the number of queries per page, click "Rows to Display" and select a value from the list.
- To change the total number of queries in the table, click "Total no. of Queries" and select a number from the list.
Looking to purchase Navicat Monitor for MySQL/MariaDB? It's now available via monthly and yearly subscriptions!


