

In last week's How the MySQL 8 Performance Schema Helps Diagnose Query Deadlocks blog, we had a crash course on Mutexes and Threads, learned about the MySQL Performance Schema, and applied a few queries against it for investigating performance bottlenecks. In today's follow-up will present a different approach to bottlenecks and deadlock investigation using Navicat Monitor.
Navicat Monitor at a Glance
Navicat Monitor is an agentless remote server monitoring tool for MySQL/MariaDB that is packed with features to make monitoring your database (DB) instances as effective and easy as possible. The term "agentless" is key because it describes a server-based architecture that does not require any software installation on the servers being monitored. Moreover, Navicat Monitor is accessible from anywhere via a web browser, thus providing you unhampered access to easily and seamlessly track your servers from anywhere in the world, at any time of day or night.
It boasts a whole host of features. Here are some of them, listed by screen:
- Real-time Interactive Overview
- View all registered MySQL/MariaDB instances and availability groups on one central web-based interface
- Monitor the live MySQL/MariaDB metrics, CPU, memory and swap usage on host machines
- Explore historical metrics in an hour
- Instance Details
- Agentless remote monitoring
- Generate reports for server performance metrics
- Export reports to PDF files
- Alerts
- Come preconfigured with over 40 fully-customizable alert policies
- Get helpful advice on how to improve server performances
- Use SMTP, SMS, SNMP Trap and Slack with customizable thresholds
- Query Analyzer
- Analysing Slow Query Log and General Query Log
- Find out queries having the biggest impact on your system
- Store a history to diagnose deadlock problems
- Replication Monitoring
- Displays your Replication Topologies and enable you to quickly see the status of each replication
- Replication error history for replication trouble shooting
- Send alerts when any replication problems are detected
- Security Monitoring
- Control of access to your monitoring assets and features
- Improve MySQL/MariaDB security by sending you alerts
- Detect MySQL/MariaDB hacking activities
- User Management
- Role-based access control
- User integration for OpenLDAP or Active Directory
- Restrict login or role access by IP Address
- Configuration Export and Restore
- Save the most recent configuration and restore whenever you like
- Migrate Navicat Monitor to new host
- Allow Repository Database migration
Spotting Deadlocked Queries
The Query Analyzer screen shows the summary information of all executing queries and helps you identify problematic queries, such as top queries with cumulative execution time count, slow queries, and deadlocks caused by two or more queries blocking each other. You'll find the Latest Deadlocked Query in the top portion of the screen:
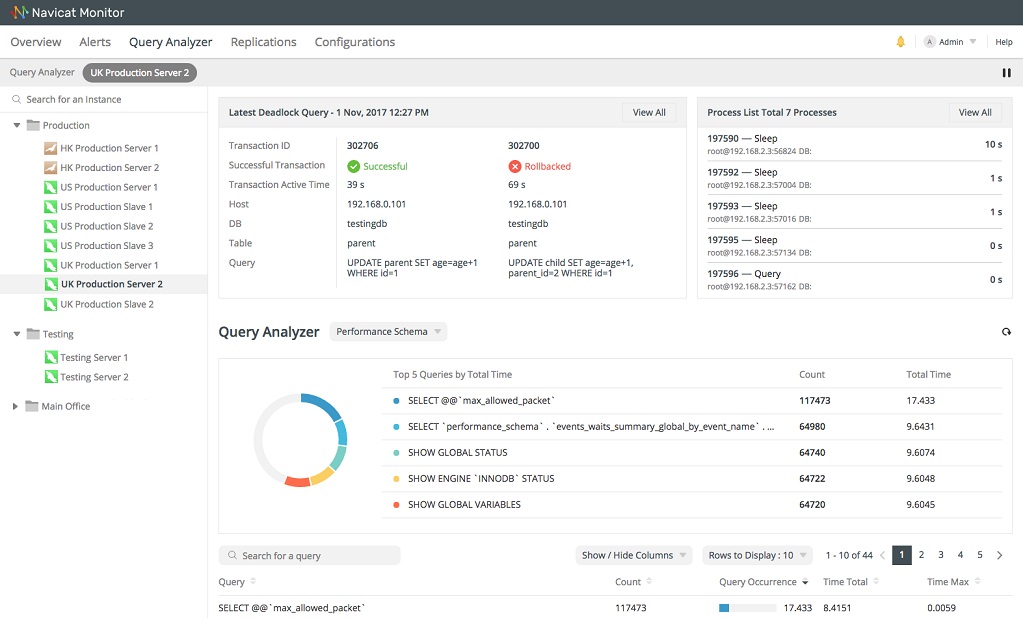
You can view previous deadlocks by clicking the View All button. Doing so opens the Deadlock page. It displays all deadlocks detected on the selected instance:
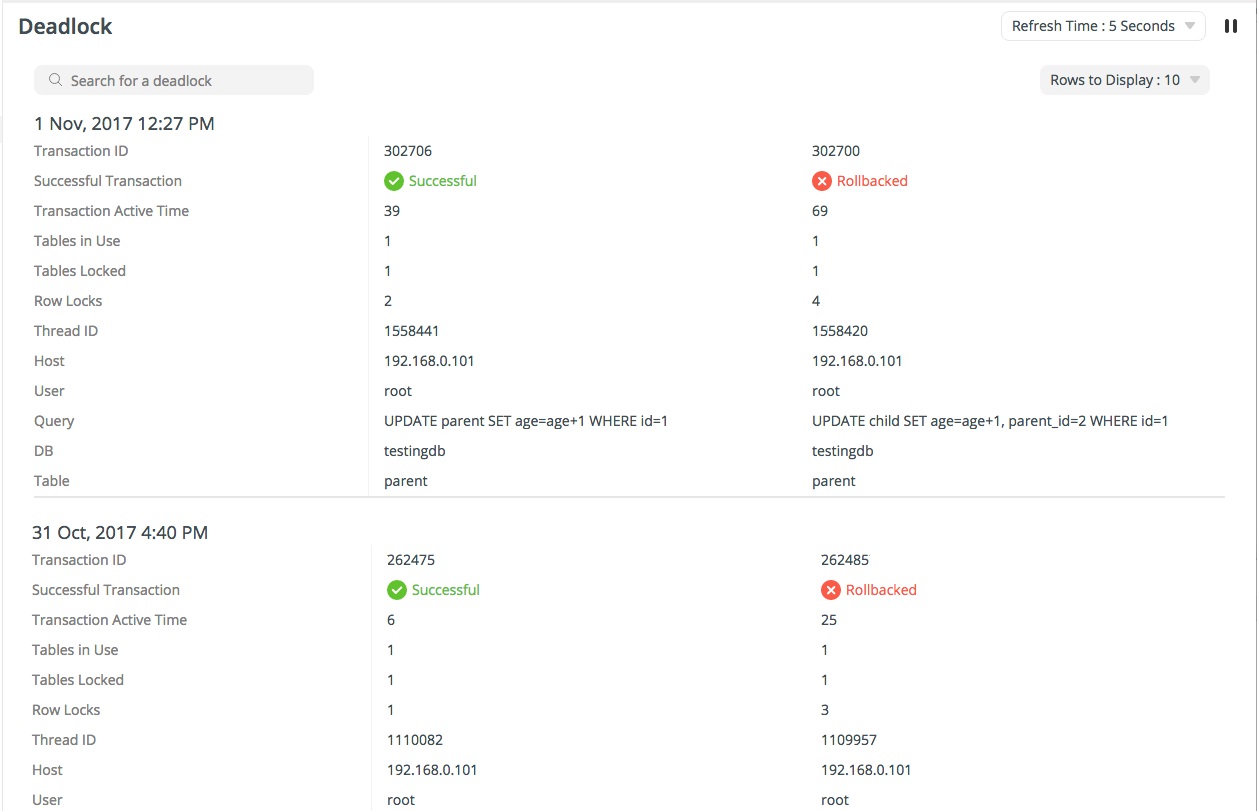
All monitored instances are shown in the left pane. Selecting an instance brings up deadlocks for that instance. You can filter the list by providing a value in the "Search for a deadlock" text box.
By default, the deadlock list refreshes every 5 seconds automatically. You can change the auto-refresh time using the Refresh Time drop-down menu. To pause the auto refresh, click the Pause button:
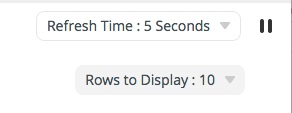
You can also set the number of rows to display via the Rows to Display drop-down menu.
Conclusion
In today's blog, we learned how to spot bottlenecks and/or deadlocks in MySQL 8 using Navicat Monitor. Thinking about purchasing Navicat Monitor for MySQL/MariaDB? It's now available via monthly and yearly subscription!


