

MySQL provides several different log files that can help you find out what's going on inside your MySQL server instance. These include:
- error log
- isam log
- general query log
- binary log
- slow log
Of these, the slow query log is especially useful for finding inefficient or time-consuming queries, which can adversely affect database and overall server performance. This blog will describe how to read and interpret slow query log output to better debug query performance.
Enabling the Slow Query Log
The slow query log consists of SQL statements that take more than long_query_time seconds to execute and require at least min_examined_row_limit rows to be examined. Hence, queries that appear in the slow query log are those that take a substantial time to execute and are thusly candidates for optimization.
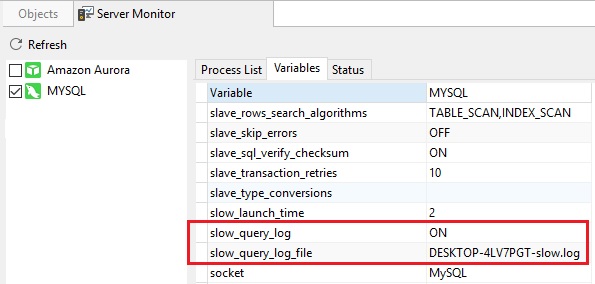
The slow query log is disabled by default so as to save disk space. You can turn it on by setting the --slow_query_log variable to 1 (ON in Navicat). Likewise, providing no argument also turns on the slow query log. Likewise, an argument of 0 (OFF in Navicat) disables the log.
In Navicat, you can access system variables using the Server Monitor tool. It's accessible via the Tools main menu command. In the Server Monitor, click on the middle Variables tab and scroll down to see the slow_query_log and slow_query_log_file server variables in the list:
Reading the Slow Query Log
Examining a long slow query log can be a time-consuming task due to the huge amount of content to sift through. Here is what a typical entry in the slow log file might look like:
# Time: 140905  6:33:11
# User@Host: dbuser[dbname] @ hostname [1.2.3.4]
# Query_time: 0.116250  Lock_time: 0.000035 Rows_sent: 0  Rows_examined: 20878
use dbname;
SET timestamp=1409898791;
...SLOW QUERY HERE...
To make reading the log contents easier, you can use the mysqldumpslow command-line utility to process a slow query log file and summarize its contents:
~ $ mysqldumpslow -a /var/lib/mysql/slowquery.log
 Reading mysql slow query log from /var/lib/mysql/slowquery.log
 Count: 2  Time=316.67s (633s)  Lock=0.00s (0s)  Rows_sent=0.5 (1), Rows_examined=0.0 (0), Rows_affected=0.0 (0), root[root]@localhost
...SLOW QUERY HERE...
Navicat Query Analyzer
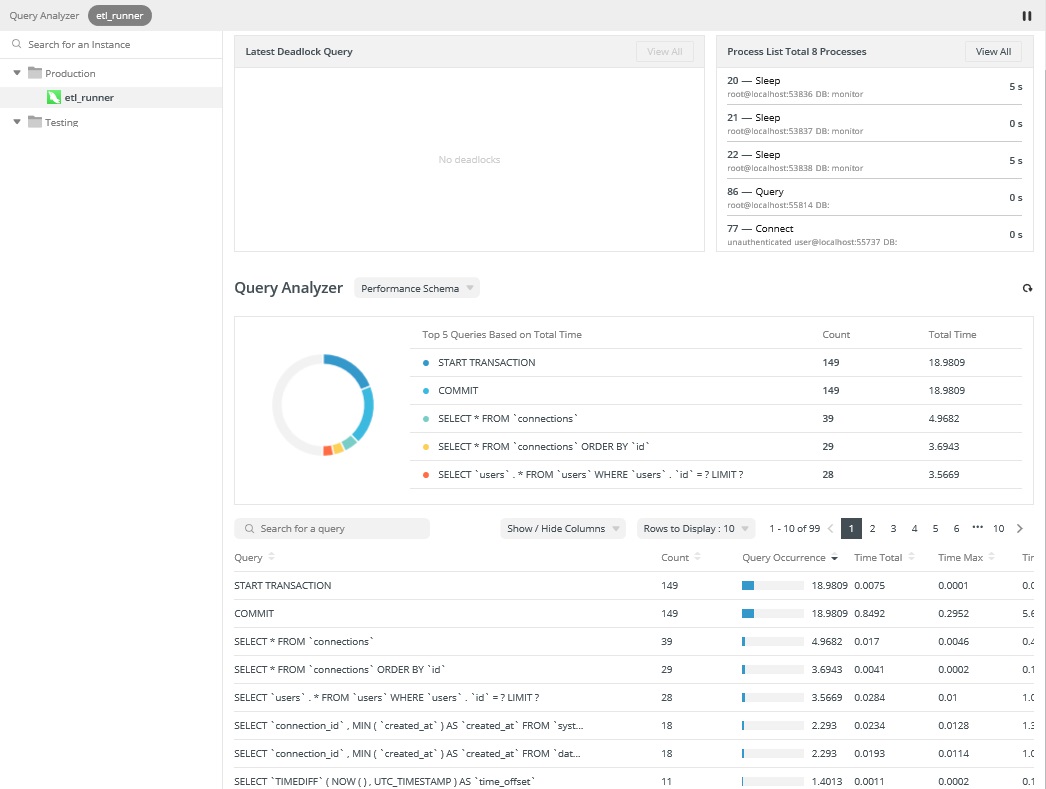
Navicat Monitor's Query Analyzer tool provides a graphical representation of the query logs that makes interpreting their contents much easier. In addition, the Query Analyzer tool enables you to monitor and optimize query performance, visualize query activity statistics, analyze SQL statements, as well as quickly identify and resolve long running queries.
In addition to the Slow Query Log, the Query Analyzer collects information about query statements using one of the following methods:
- Retrieve the General Query Log from the server and analyze its information.
- Query the performance_schema database and analyze it for specific performance information.
You'll find the Query Analyzer section below the Latest Deadlock Query and Process List sections:
Conclusion
This blog presented a few ways to read slow query log output to better debug the performance of your queries.
Click here for more details about all of Navicat Monitor's features, or, download the 14-day fully functional free trial!


