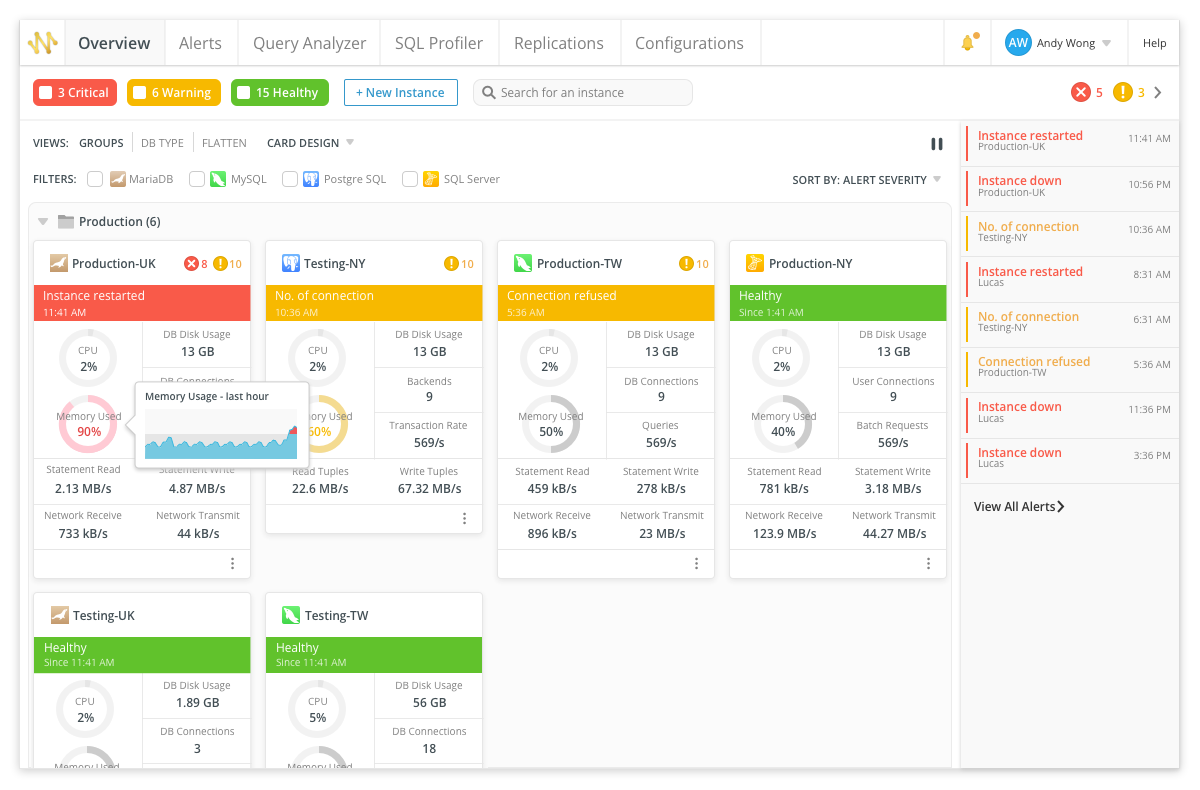
Maximized visibility
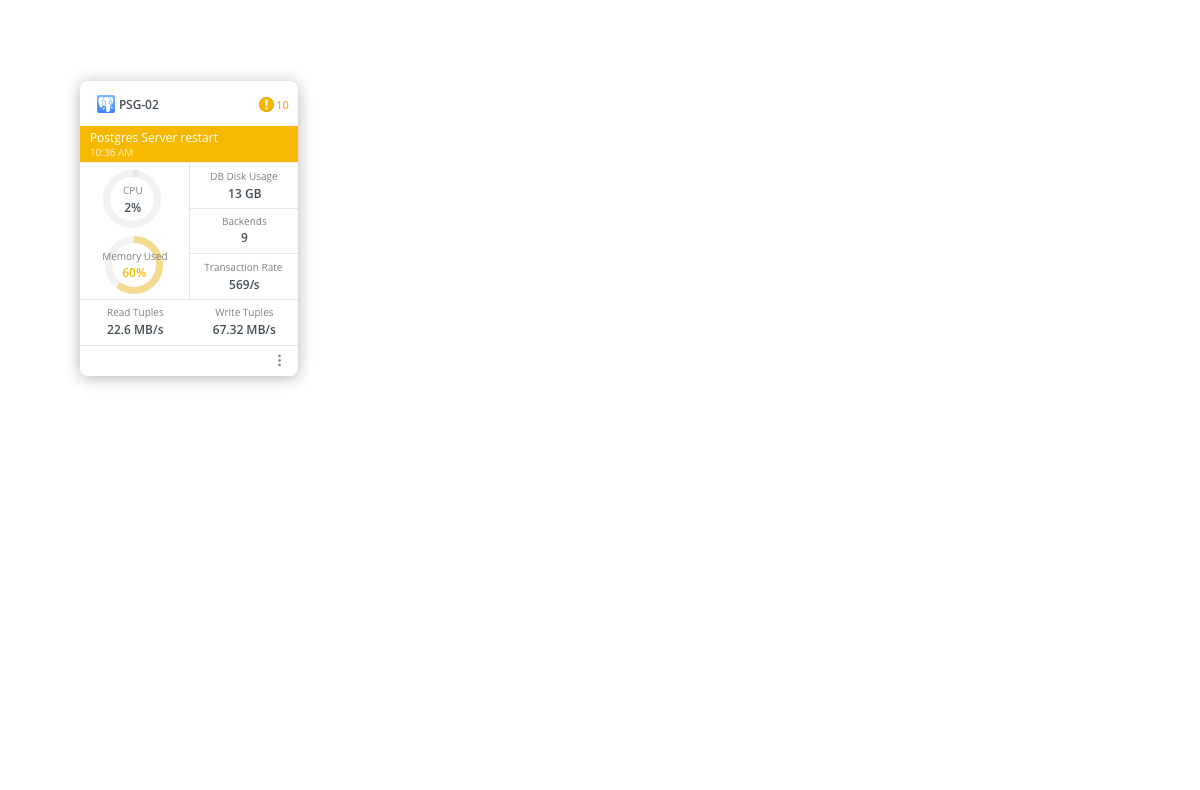
Navicat Monitor now available for PostgreSQL users.
Our intuitive dashboard focuses on delivering information essential to our new PostgreSQL users. Navicat Monitor translates metric data into a visual context that makes it easier for you to interpret data that is otherwise difficult to understand. It enables you to define warning thresholds so you can be alerted when a problem is developing. You can also monitor the health of replication based on the hierarchy and relationship of master and slave servers. That way, you can determine your next steps to radically improve the performance of your PostgreSQL Server.
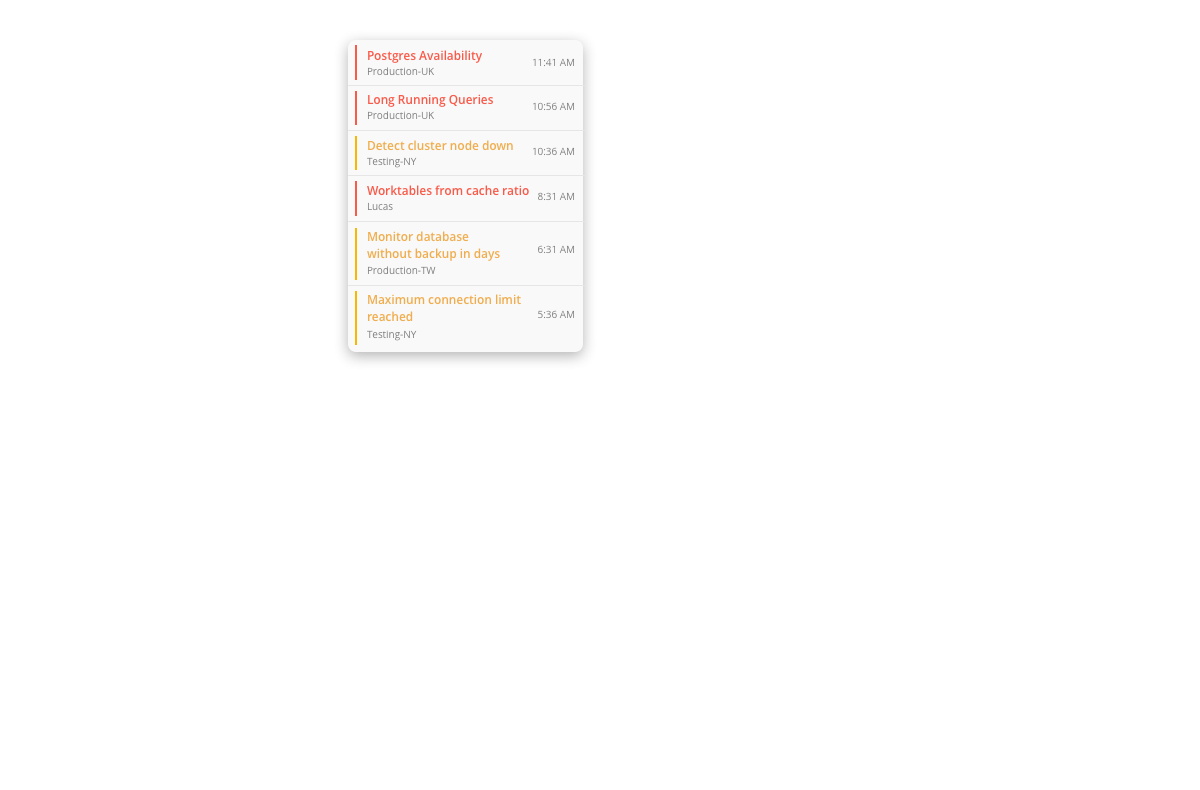
Optimize your slow queries to increase performance.
Get an overview of all top queries in your environment over time.
The Long Running Queries chart visualizes all the top queries based on duration of execution, wait types, CPU usage, and the number of reads and writes performed on the databases hosted by the specified instance. You can easily identify the queries that are running for an inordinate amount of time and take appropriate actions to resolve them.
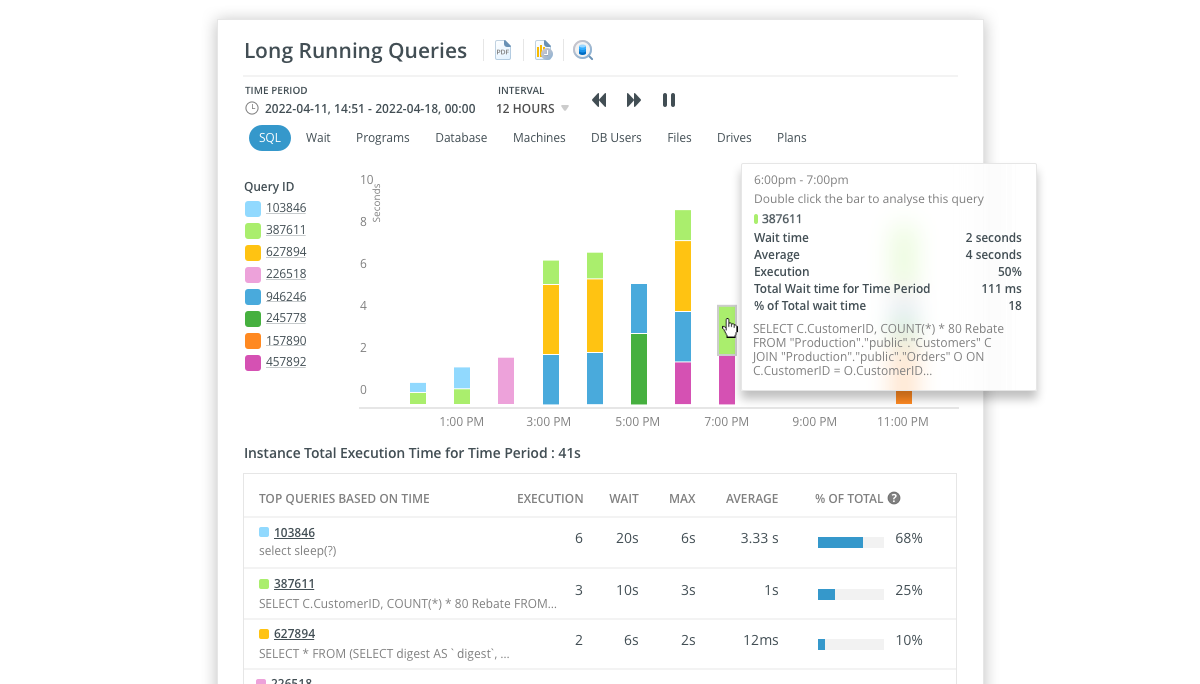
Dig deeper into an individual query to track down what it was waiting on.
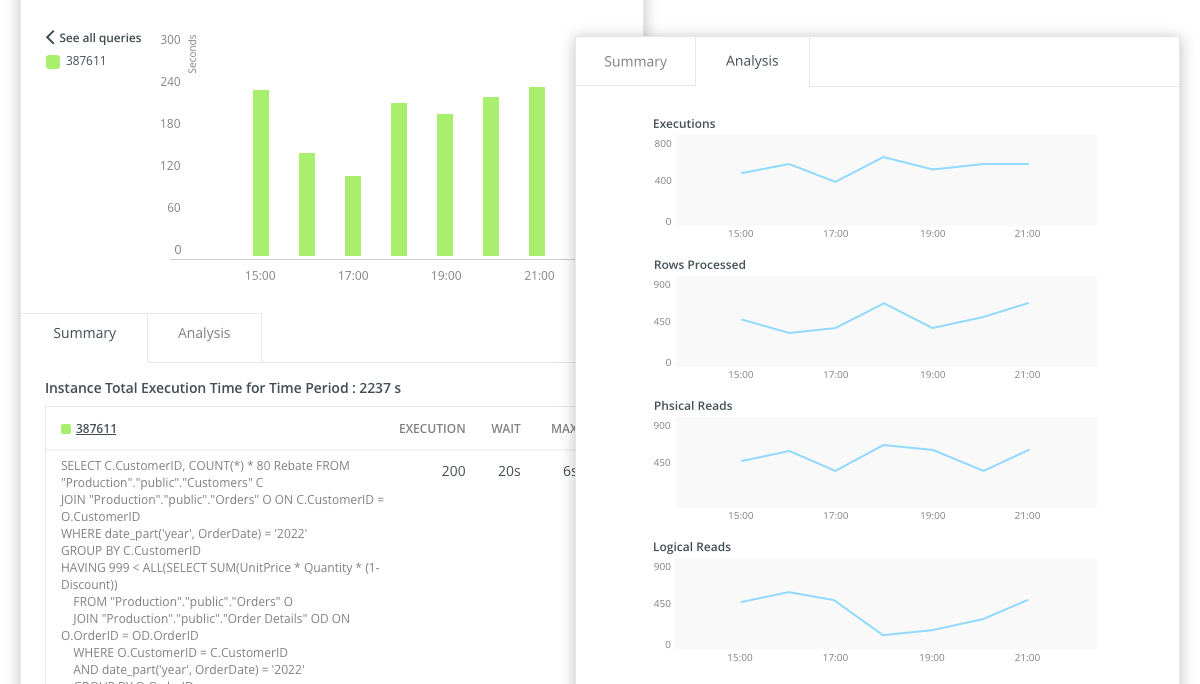
The Long Running Queries chart visualizes all the top queries based on duration of execution, wait types, CPU usage, and the number of reads and writes performed on the databases hosted by the specified instance. You can easily identify the queries that are running for an inordinate amount of time and take appropriate actions to resolve them.
List out the causes of a long running query and warn you about critical issues.
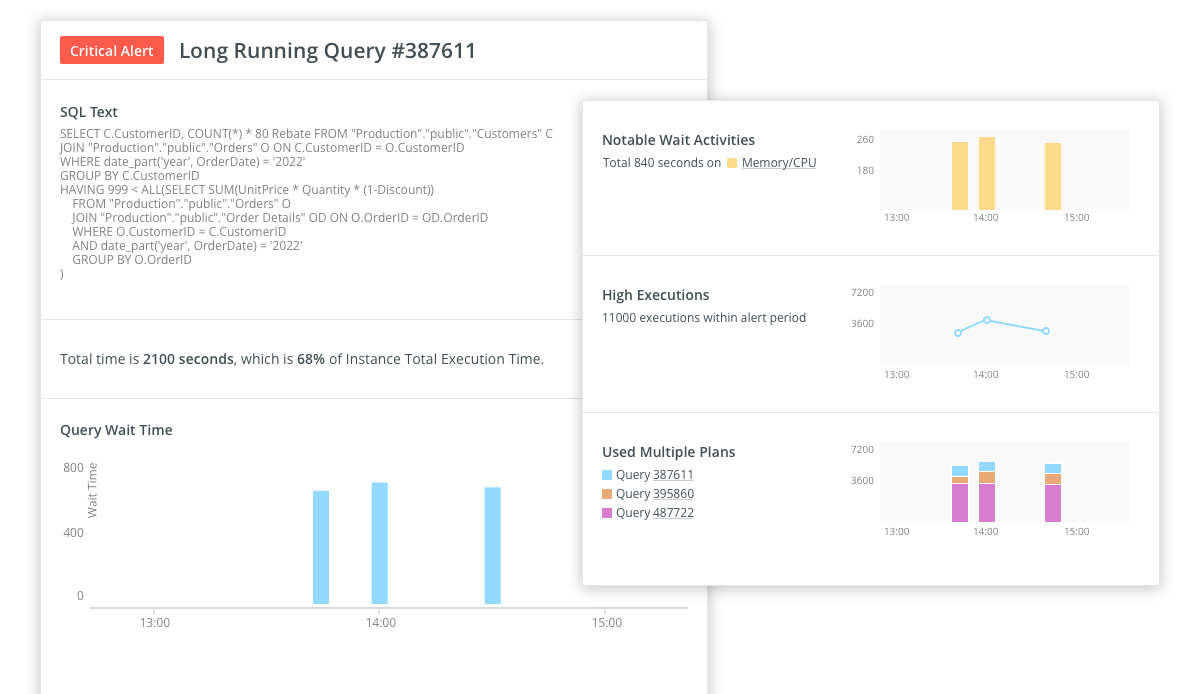
The Long Running Queries chart visualizes all the top queries based on duration of execution, wait types, CPU usage, and the number of reads and writes performed on the databases hosted by the specified instance. You can easily identify the queries that are running for an inordinate amount of time and take appropriate actions to resolve them.
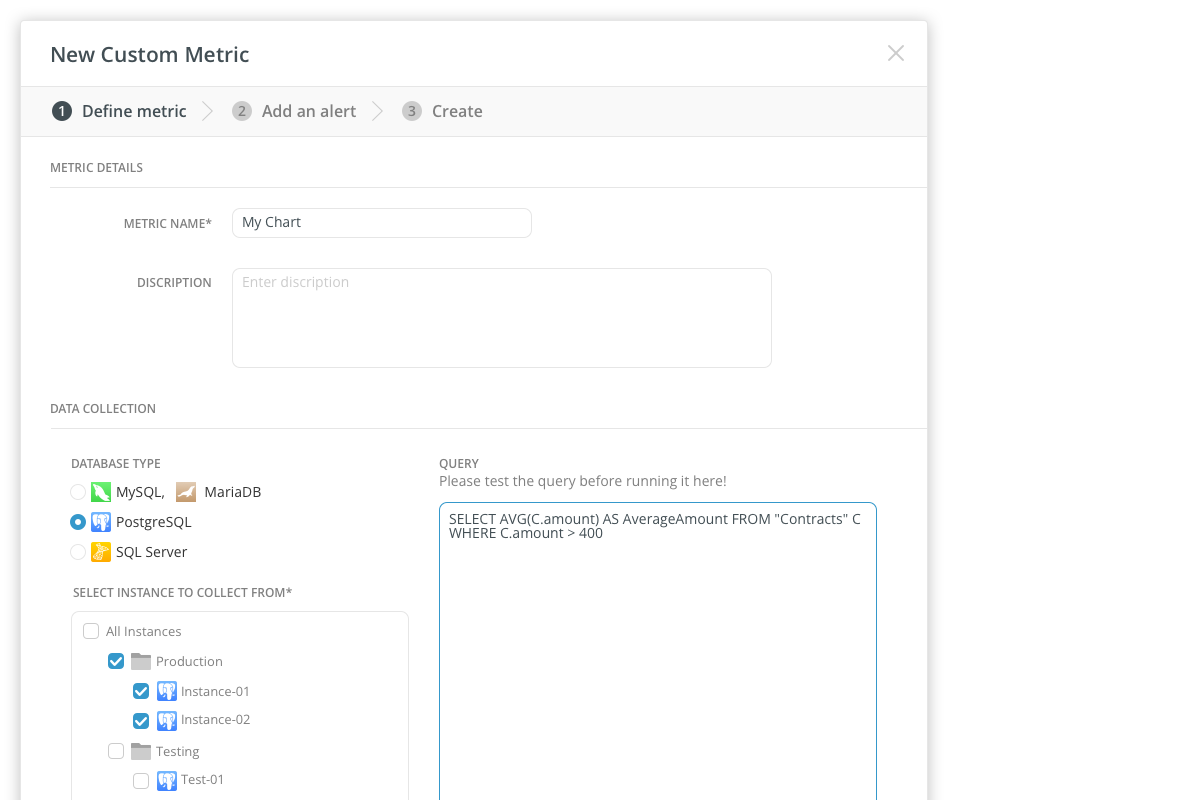

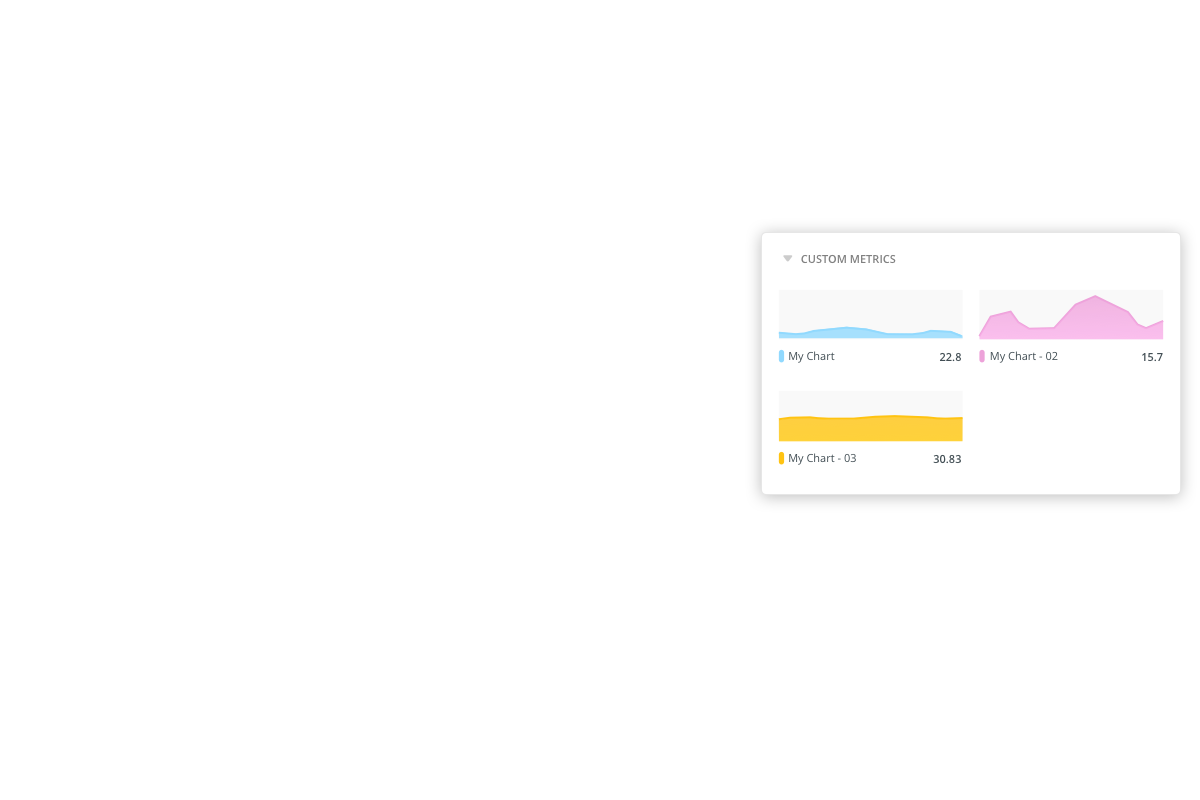

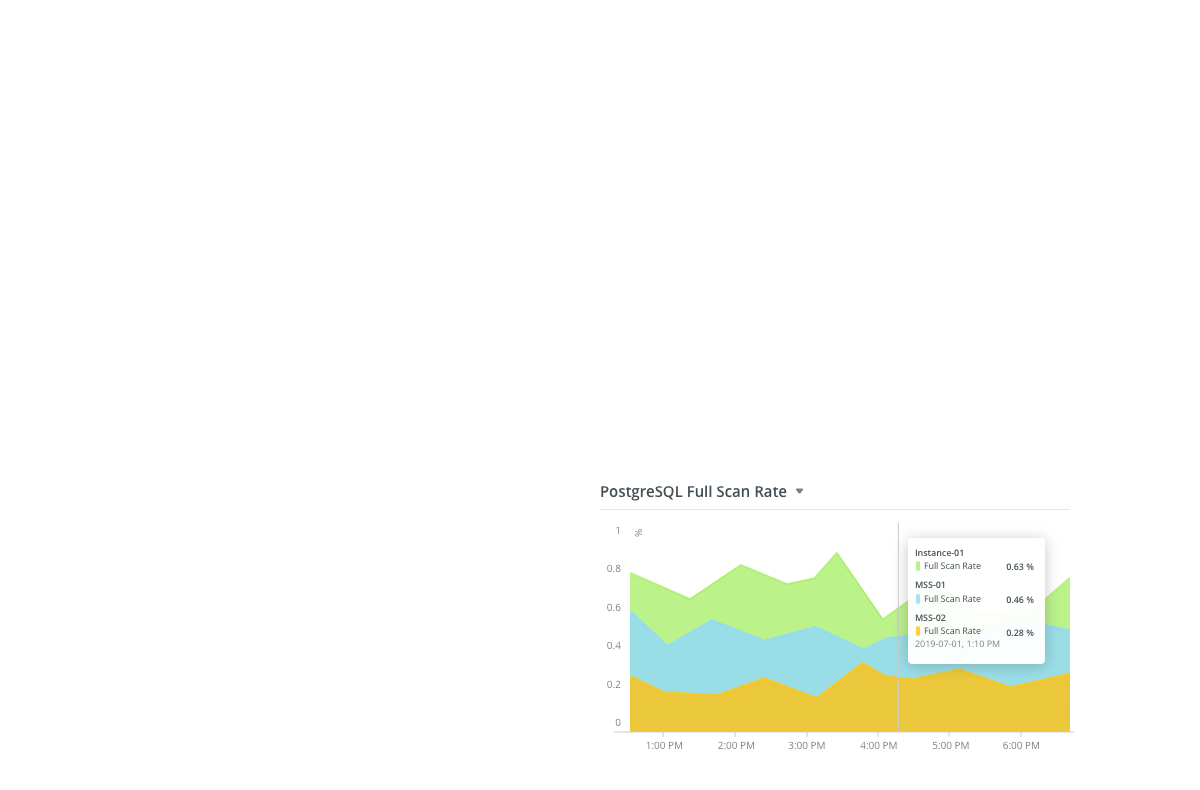
Tailor a custom chart for your own business needs.
Navicat Monitor allows you to build custom metrics to track everything you need. You can write your own query to collect performance metrics for specific instances, and receive alerts about your custom data when the metric value passes certain thresholds and durations. It’s easy to set up a custom metric – just take your time and think through exactly what you wish to collect.
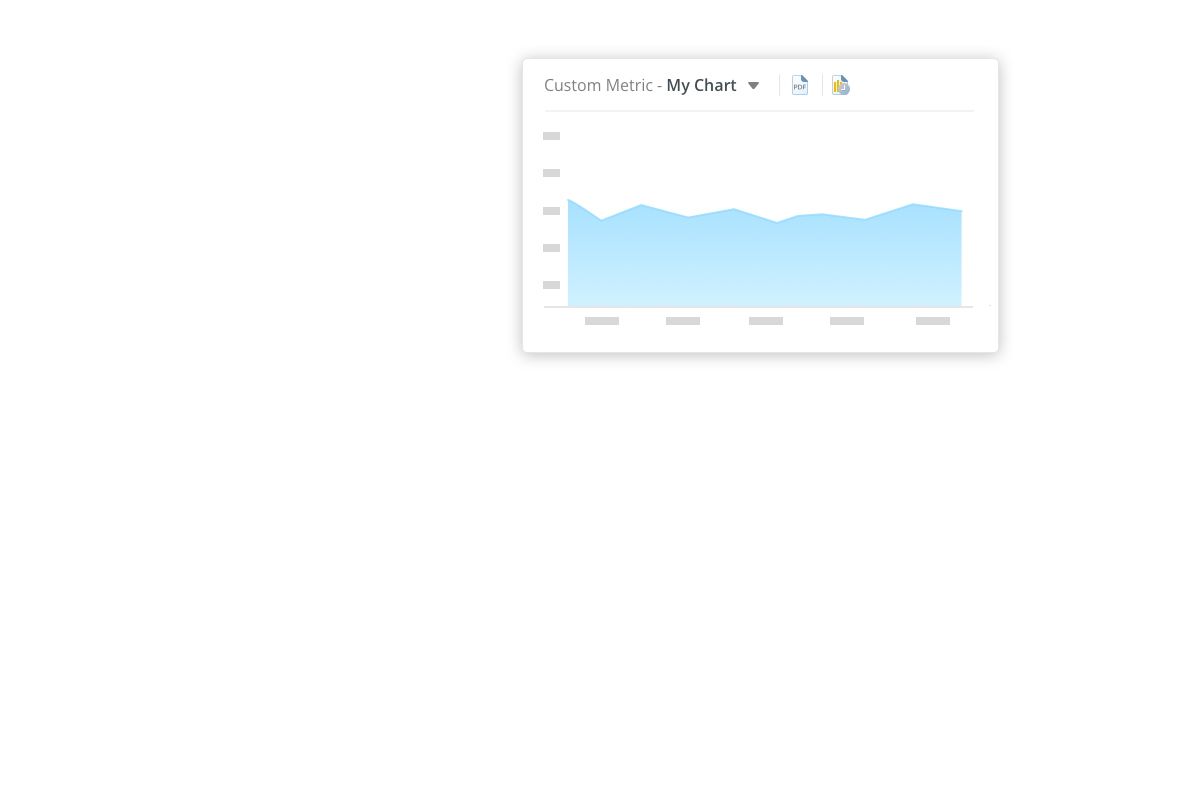
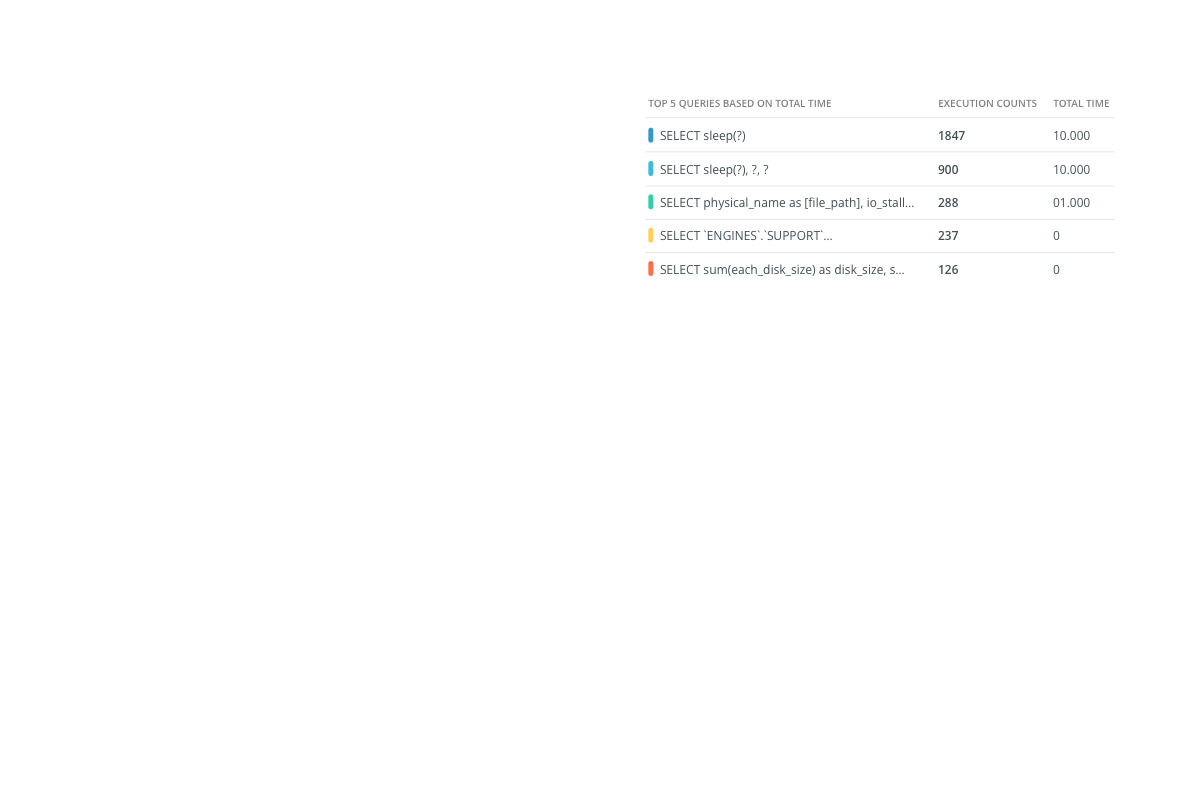
Power up your database performance.
Show the basic information of the queries. You can get graphical execution plans for each query with statistics for all of its components.
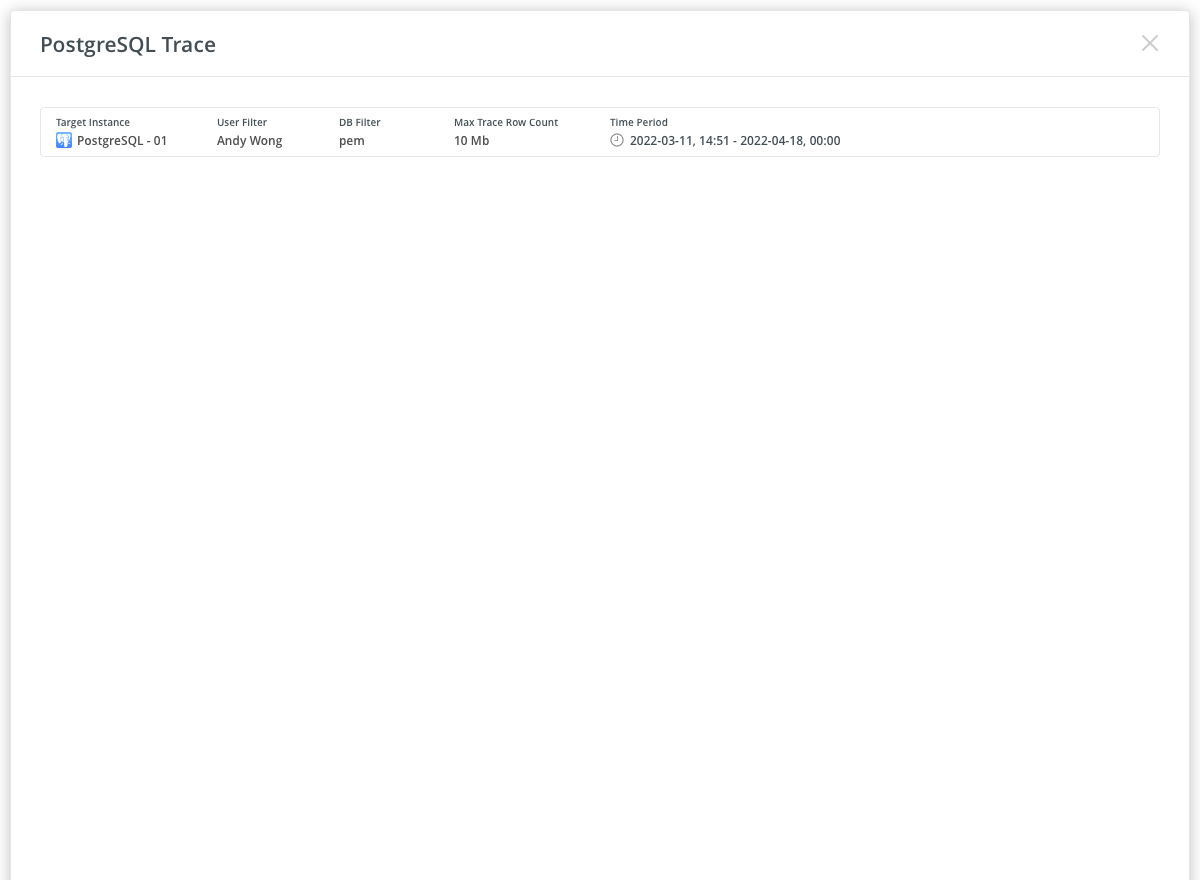
SQL Profiler helps you trace, identify, and troubleshoot problems in PostgreSQL server. You can start by identifying long-running queries in just a few clicks. Then, you can effectively analyze your queries to evaluate whether they can be optimized, specify a schedule for the trace execution, and drastically improve your database performance.
Power up your database performance.
Show the basic information of the queries. You can get graphical execution plans for each query with statistics for all of its components.
SQL Profiler helps you trace, identify, and troubleshoot problems in PostgreSQL server. You can start by identifying long-running queries in just a few clicks. Then, you can effectively analyze your queries to evaluate whether they can be optimized, specify a schedule for the trace execution, and drastically improve your database performance.
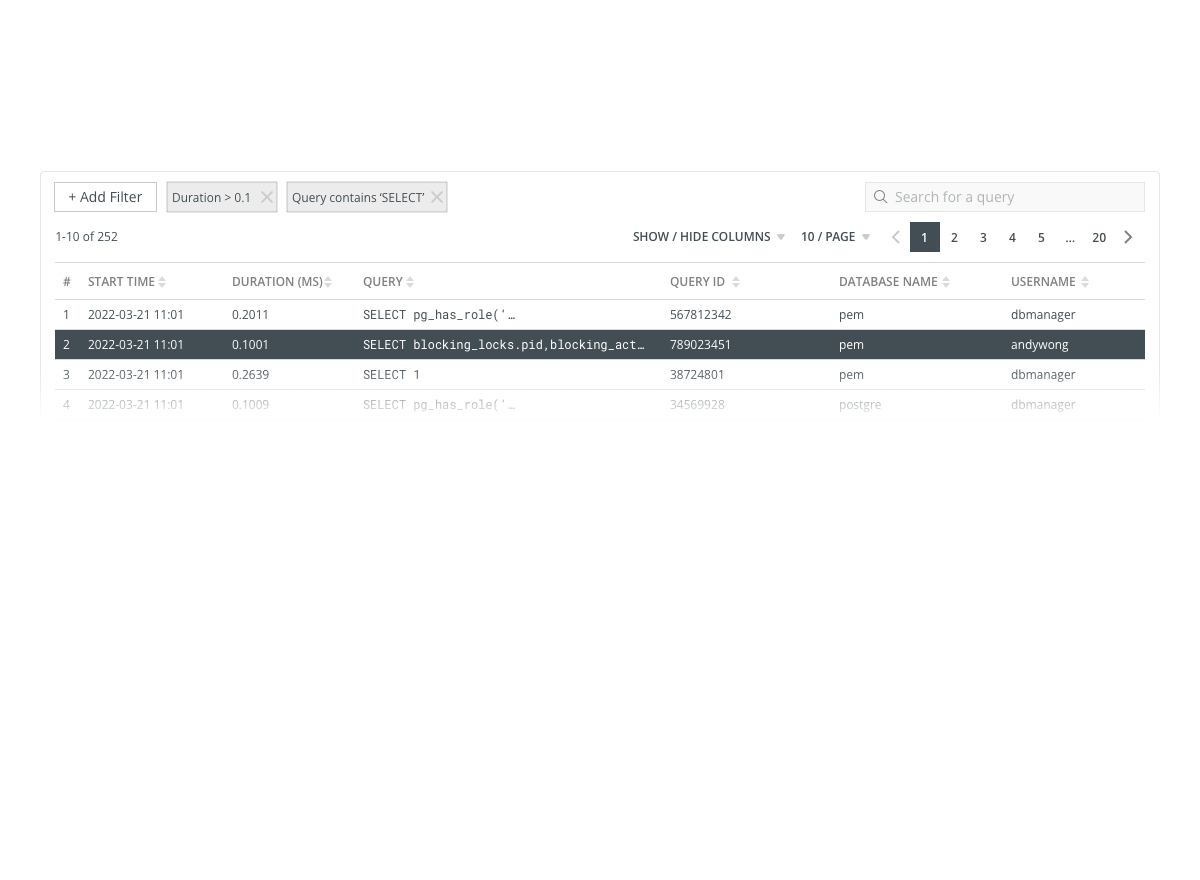
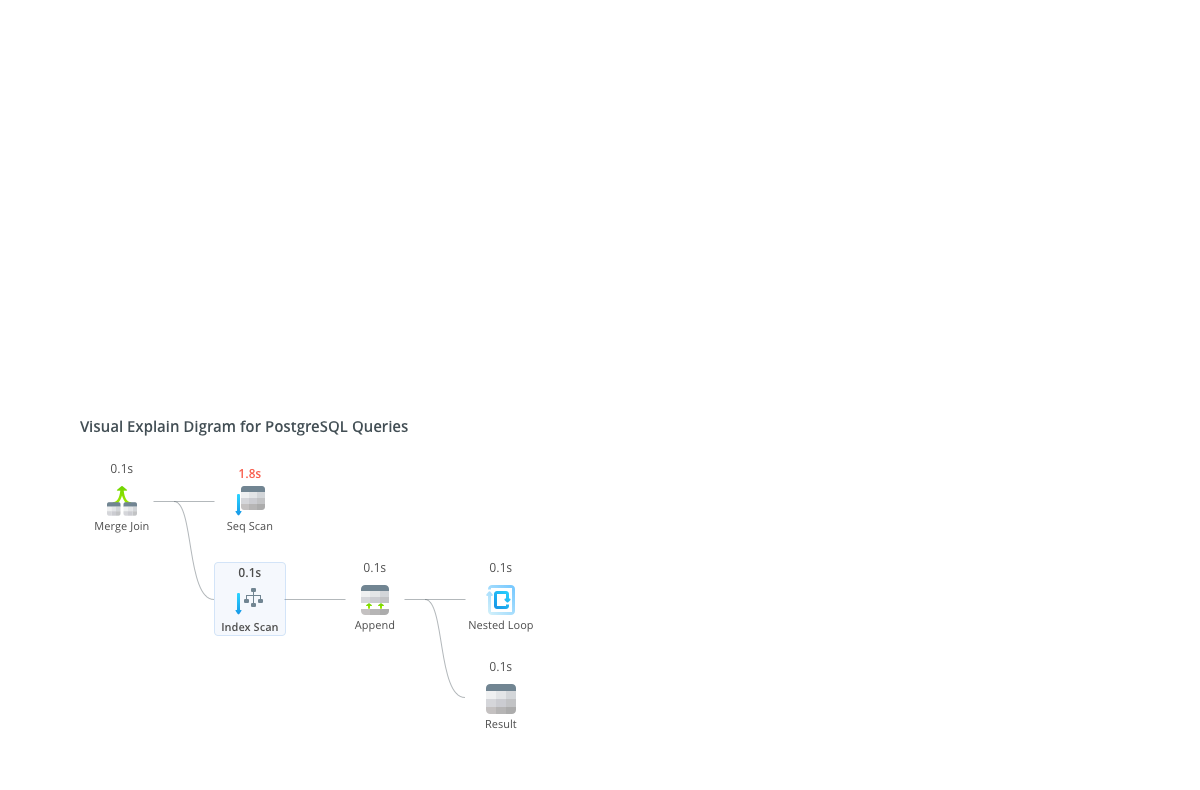
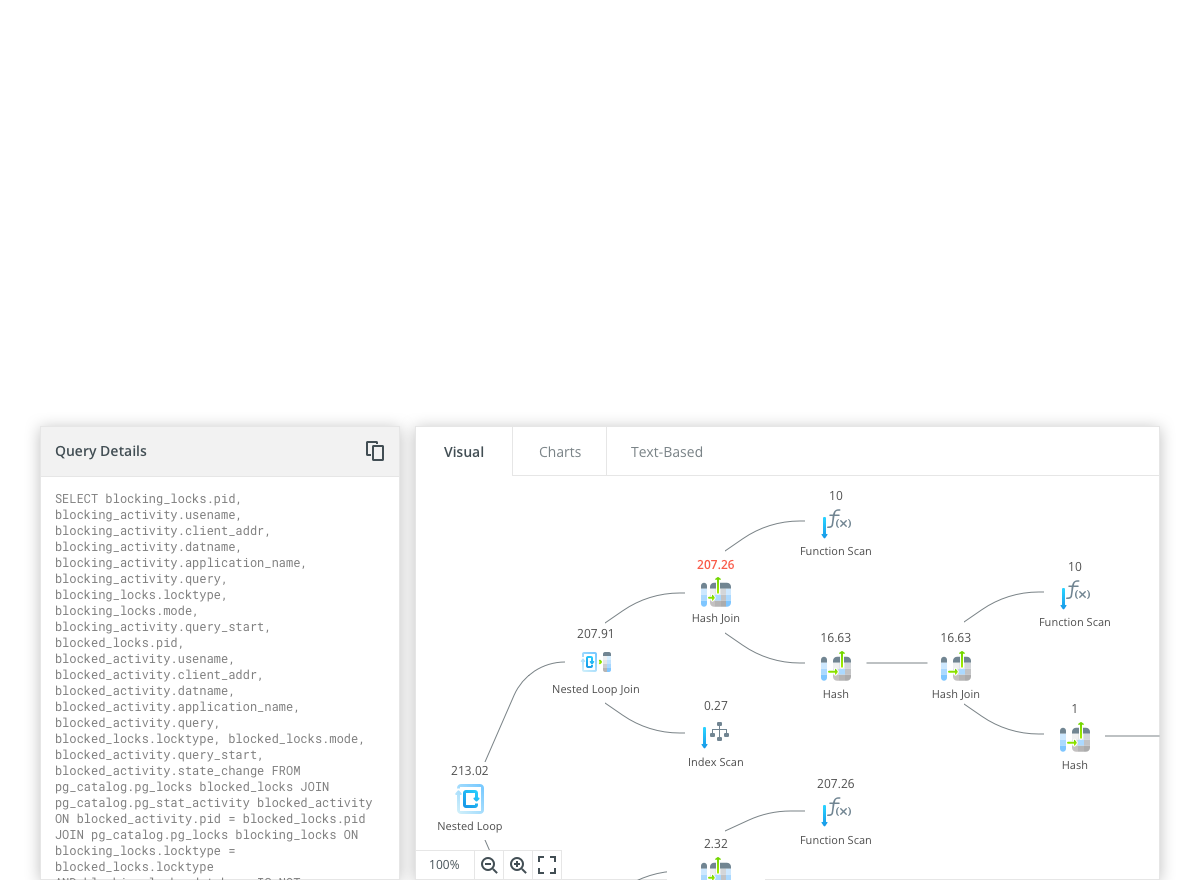
Power up your database performance.
Show the operations performed by the query and the data passed between them. You can understand what is happening internally from its statistical information.
Hover to see details.
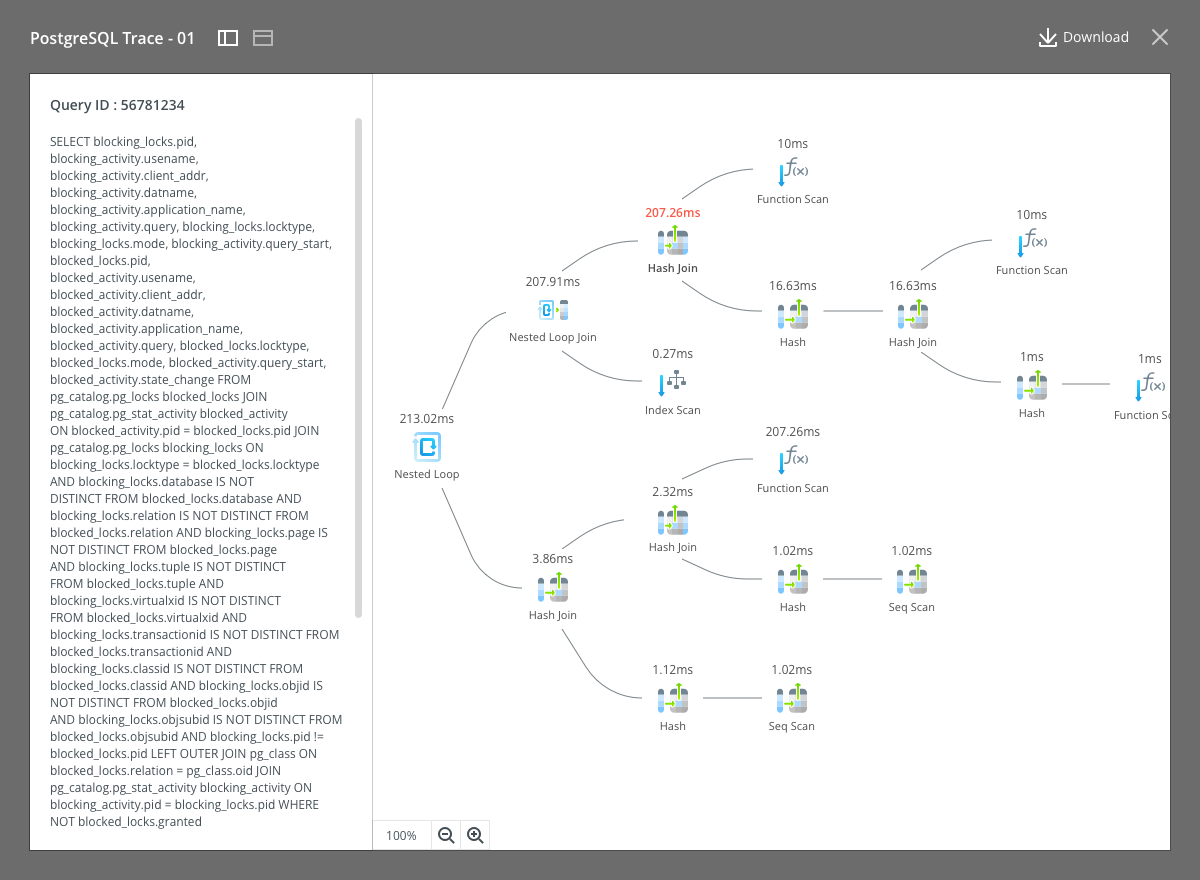
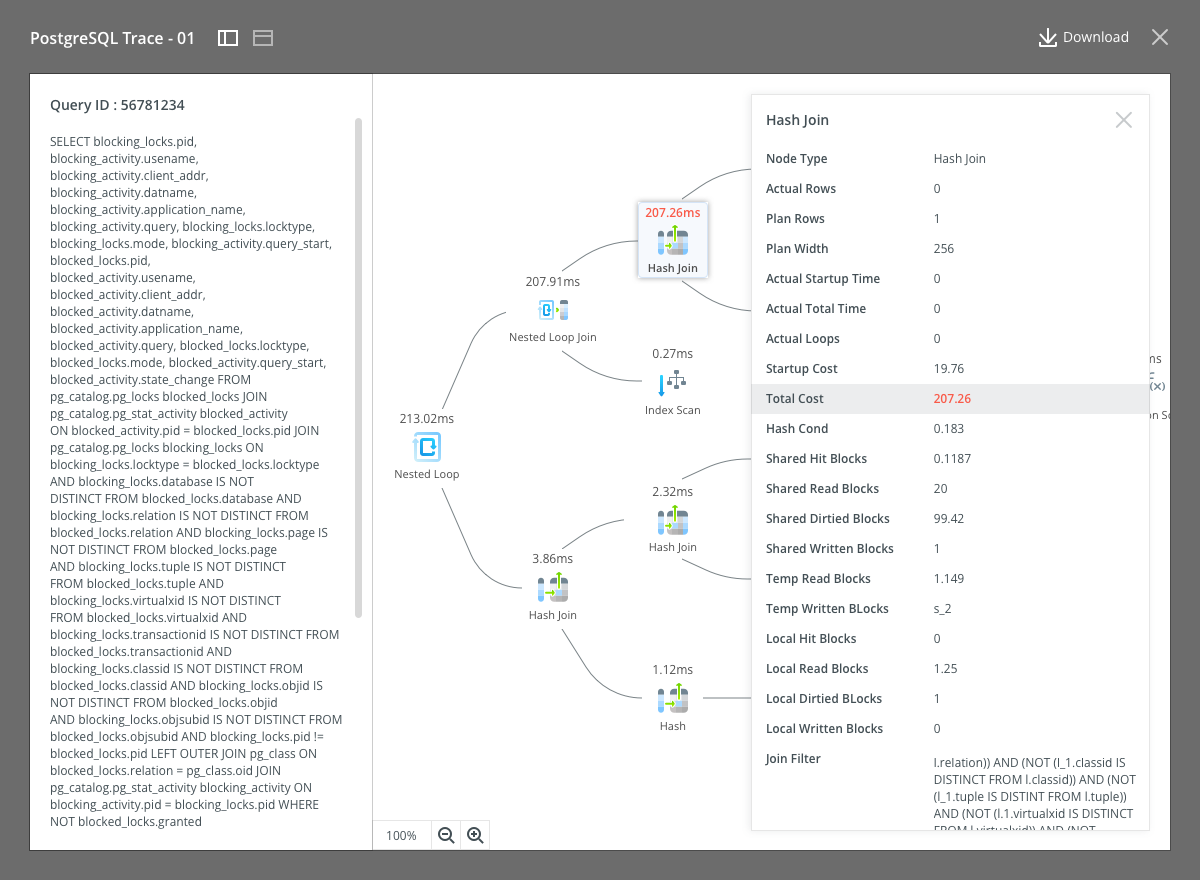
SQL Profiler helps you trace, identify, and troubleshoot problems in PostgreSQL server. You can start by identifying long-running queries in just a few clicks. Then, you can effectively analyze your queries to evaluate whether they can be optimized, specify a schedule for the trace execution, and drastically improve your database performance.
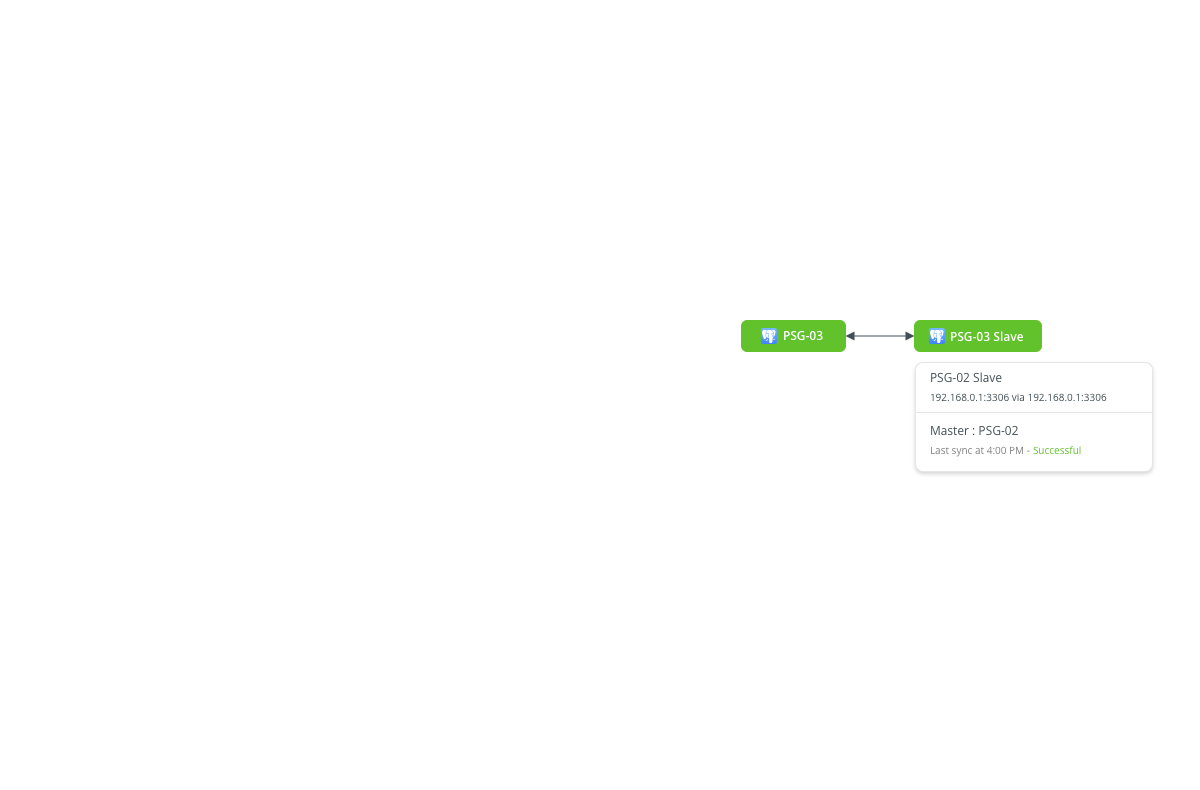
Extreme reliability for your most critical data.
Navicat Monitor provides a systemic view of replication activity. It visually displays the hierarchy and relationship of master servers and slave servers, and presents to you all the information related to monitored replication. Navicat Monitor provides detailed information on status, configuration, and performance of the replication, so you can easily monitor the health of replication, diagnose replication problems, and ensure the replication works seamlessly.
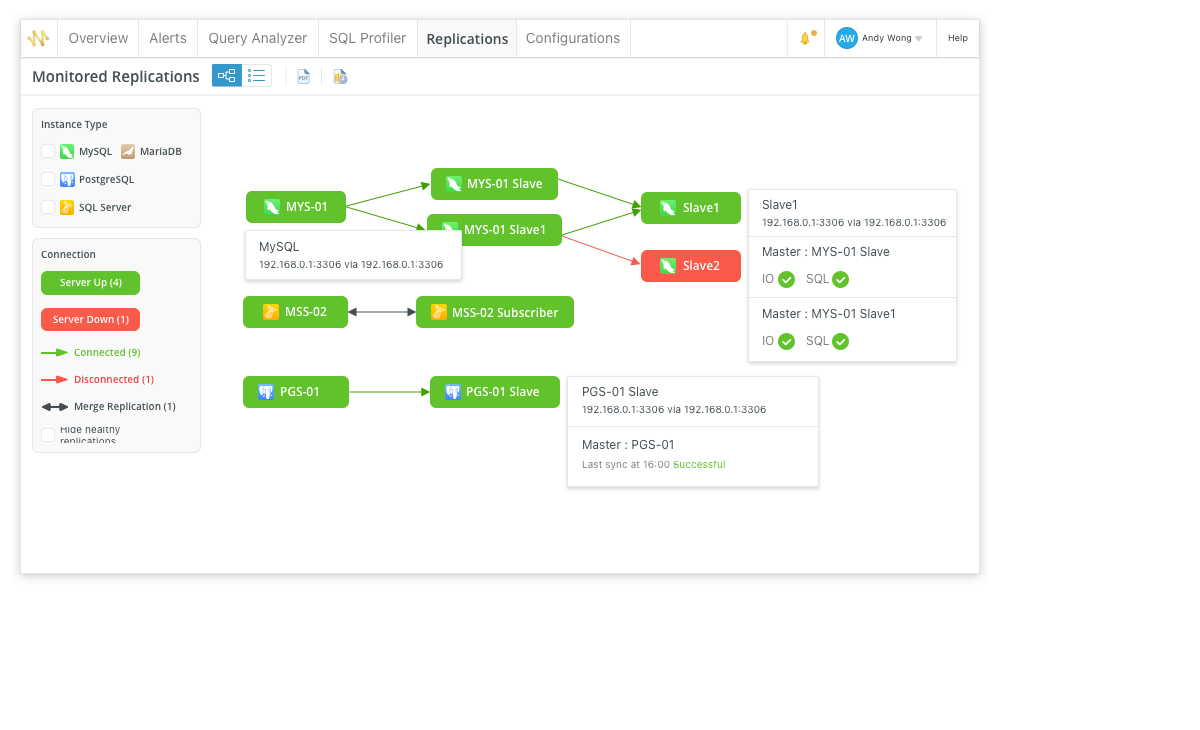
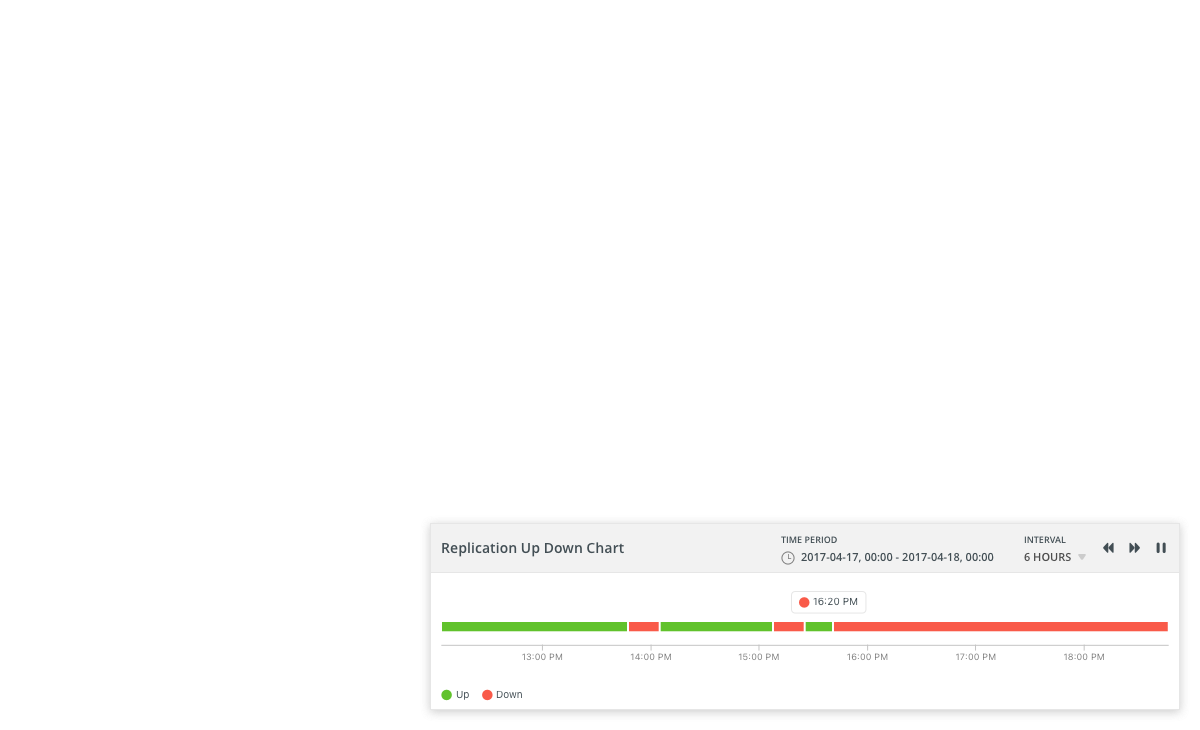
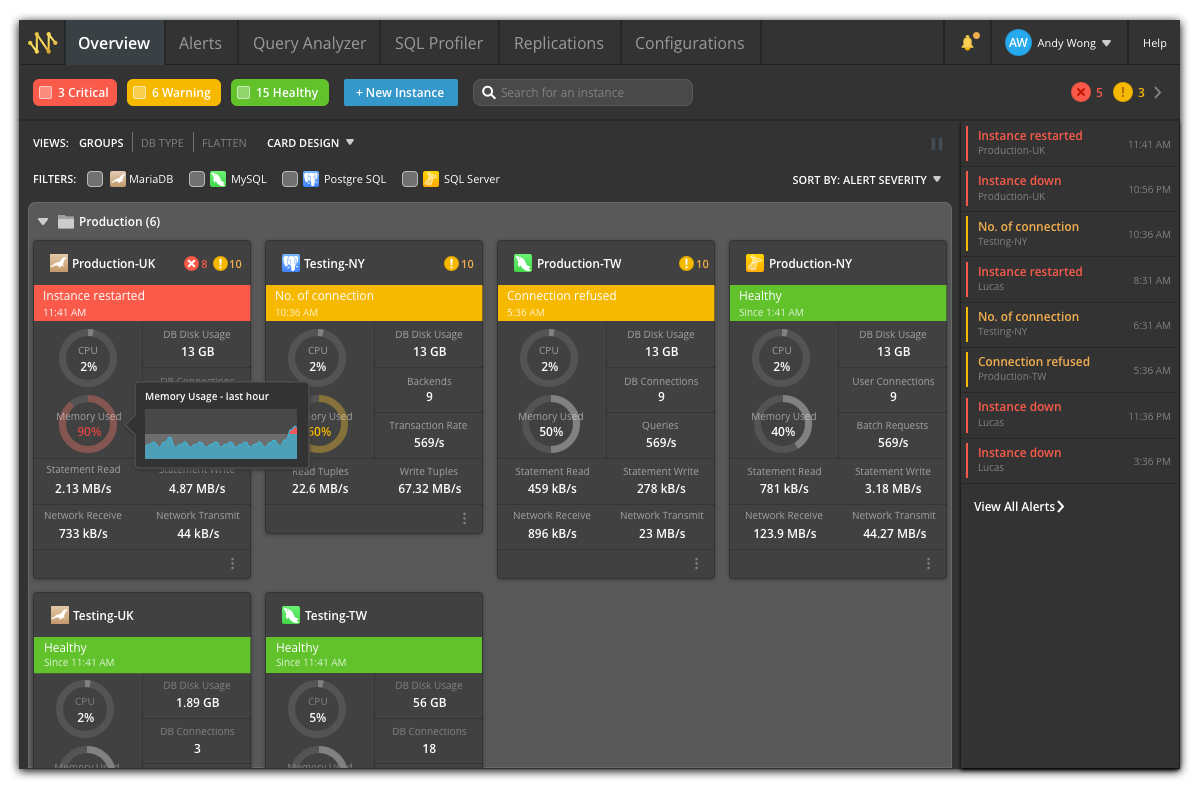
Stay focused on your work.
Dark mode support has arrived in our 2.1 update. Navicat Monitor now supports both light and dark interface styles. You can show a dark mode version as your default viewing preference.