

Schema Analysis is useful in verifying your schemas, visualizing data distributions and for identifying data outliers. Available only for MongoDB, the Navicat for MongoDB Collection and Data Viewer toolbars include command buttons for analyzing your collection schema and document data.
In today's blog, we'll be exploring Navicat for MongoDB's analysis tool.
Schema Analysis
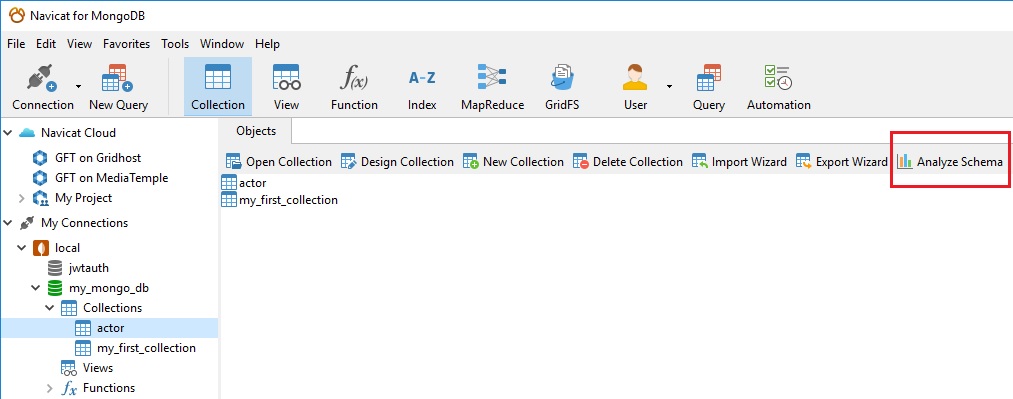
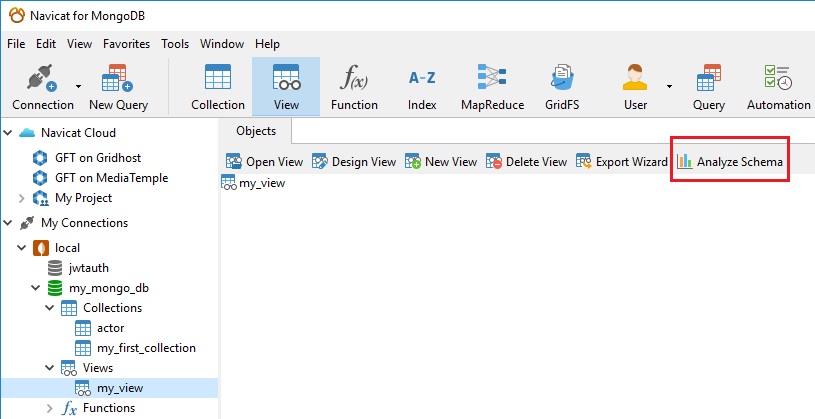
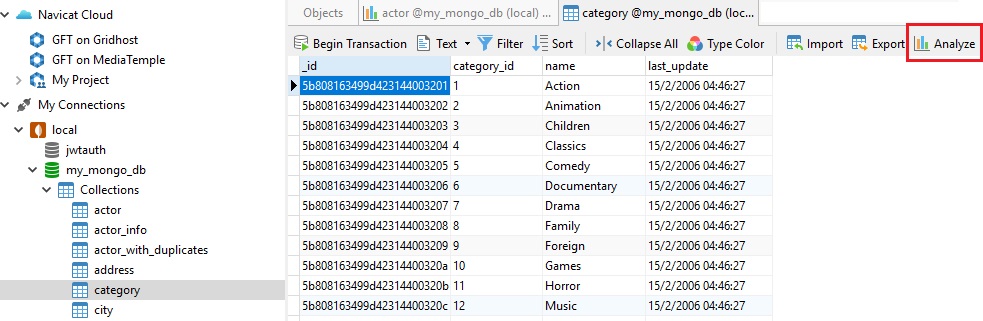
In the Non-Essentials Edition of Navicat for MongoDB, selecting a Collection or a View in the Object tree enables the Analyze Schema button on the toolbar:
Clicking the Analyze Schema button brings up the Analyze screen in a new tab:
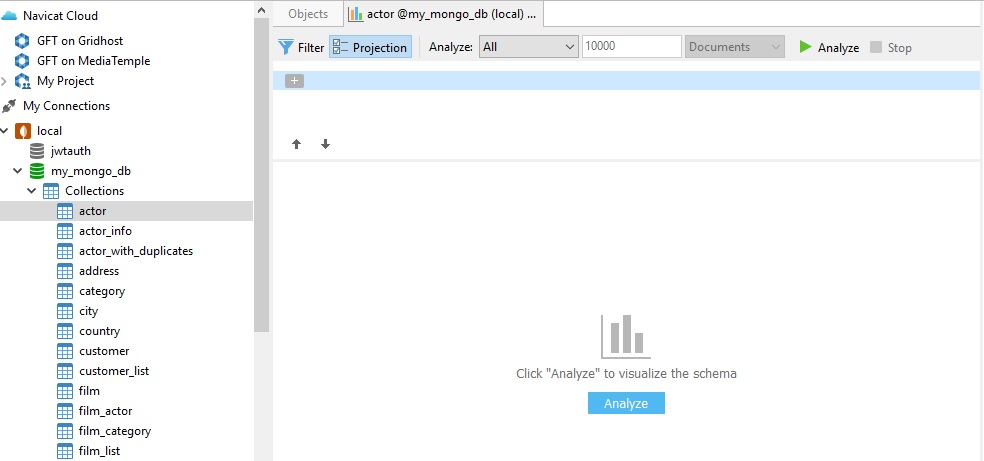
The Analyze screen contains a number of options for fine tuning your analysis. These include:
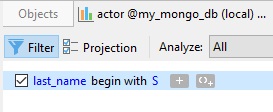
- Filter: acts much like the WHERE clause of a SELECT query and is useful for narrowing down the data that is analyzed.
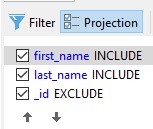
- Projection: Allows us to select which fields to include in the analysis. Fields may be ordered using the arrow buttons below the field list.
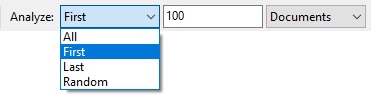
- Analyze: There are three analysis parameters which may be set to configure exactly what data will be analyzed. The three fields include:
- A dropdown containing four items: All, First, Last, and Random.
- A textbox for entering a number.
- A dropdown containing two items: Documents and Percent. The three fields may be combined to specify a virtually unlimited variety of combinations, such as:
- the first 100 documents
- the last 50 documents
- a random 250 documents
- the first 50 percent of documents
- the last 20 percent of documents
- a random 80 percent of documents
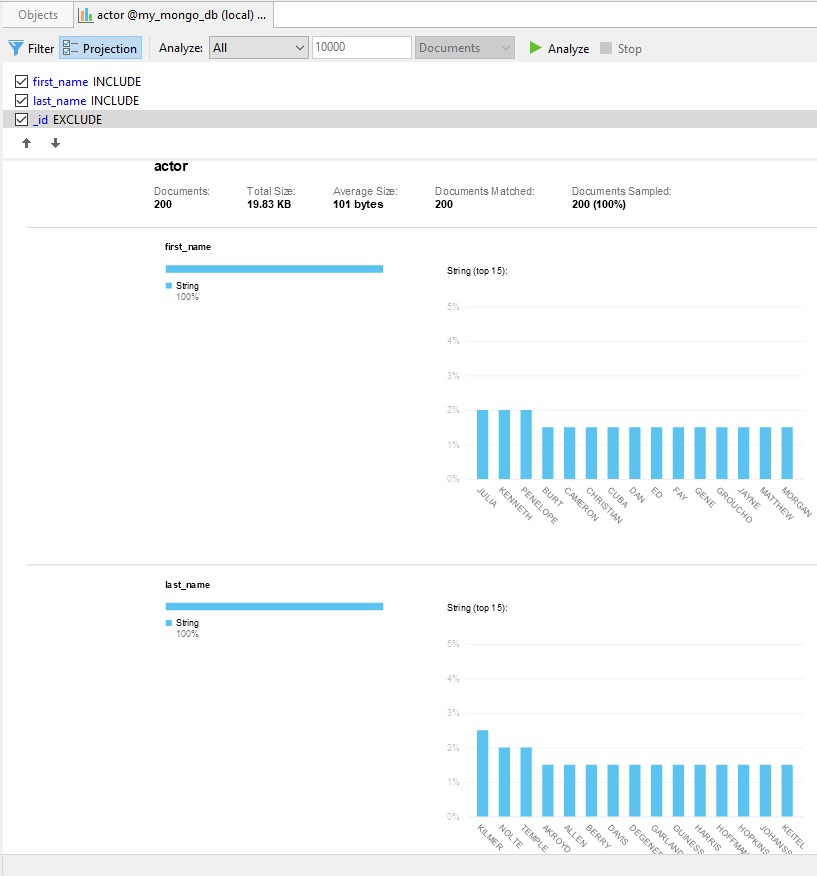
After the analysis has completed, you will see the schema analysis results. The results display visual information about the type and data distribution of selected fields. Here's an analysis that presents the top 15 first and last names of actors within a collection:
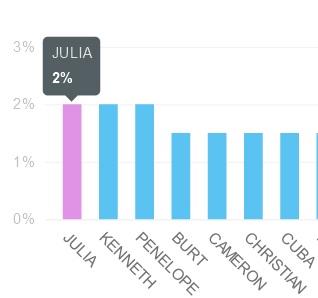
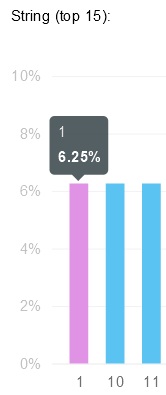
You can bring up the exact percentage of documents contain a specific value by hovering the mousepointer over the bar in the chart:
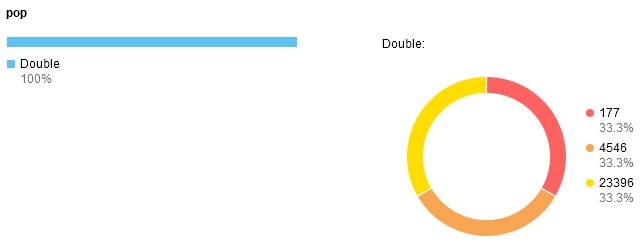
Different chart types are employed depending on the nature and distribution of the underlying data. Here's a population field presented as a Ring chart:
Analyzing Document Data
The Collection tab toolbar contains an Analyze button to analyze that document's data. It works in much the same way as the Analyze Schema button in that it displays a new tab with the analysis options for fine tuning the analysis.
Here are the results of an analysis that confirms that a collection of movie categories is evenly distributed:
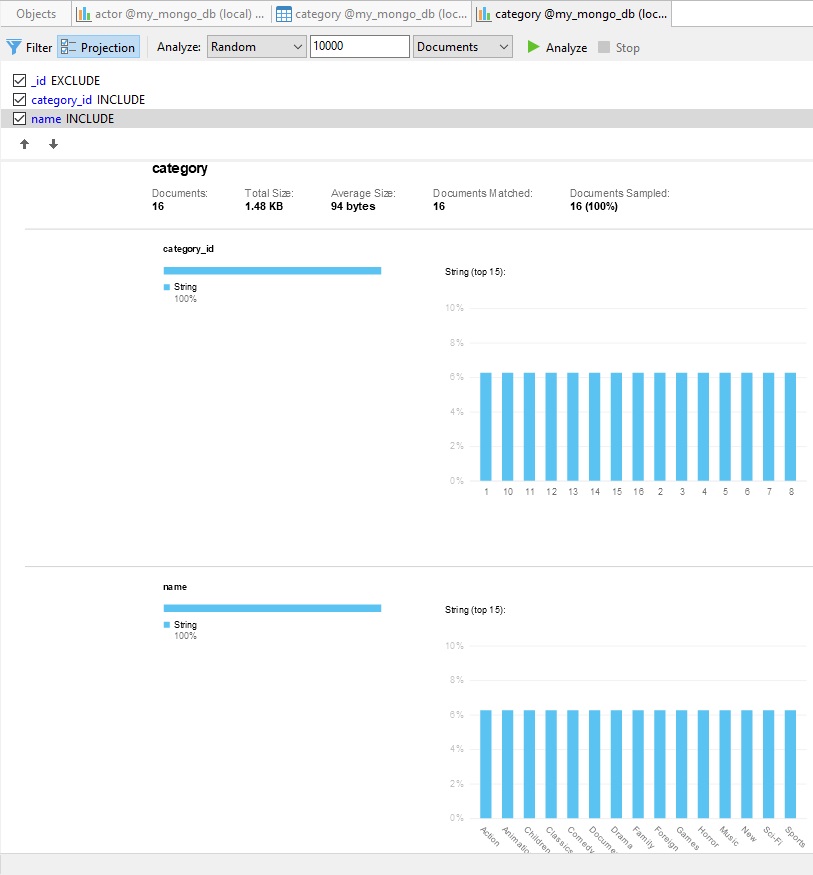
We can easily assess that documents are evenly distributed by the uniform height of the vertical bars. Moreover, hovering over each bar shows that they each make up exactly 6.25% of the collection:
Conclusion
Schema Analysis has many practical applications, from verifying your schemas, visualizing data distributions and for identifying data outliers. It's built into Navicat for MongoDB - Non-Essentials Edition. Give it a try!


