

Welcome back to this blog series on MySQL logging. We'll be referencing these first three installments later on when we talk about monitoring in Navicat Monitor for MySQL/MariaDB. Part I provided an overview of the different log types on MySQL, highlighted the most important of these, and covered the first two in the list. Part II presented the binary log in more detail. The Slow Log will be the topic of today's blog.
The slow query log contains SQL statements that take more than a certain amount of time to execute and require a given number of rows to be examined by a query. It's an important one because it greatly simplifies the task of finding inefficient or time-consuming queries, which, as I'm sure you well know, can adversely affect database and overall server performance.
Slow Query Log Parameters
You might be wondering what exactly constitutes a "slow" and/or "inefficient" query. Obviously, there is no universal one-size-fits-all answer, but the makers of MySQL - Oracle - place it at 10 seconds, which happens to be the maximum value of the long_query_time threshold variable. The minimum value of 0 causes all queries to be logged. The value can also be specified to a resolution of microseconds if you want to get very specific.
By default, administrative statements as well as queries that do not use indexes for lookups are not logged. Having said that, this behavior can be changed using log_slow_admin_statements and log_queries_not_using_indexes variables.
If you don't specify a name for the slow query log file, it will be named host_name-slow.log. The server creates the file in the data directory unless an absolute path name is given to specify a different directory. You can utilize the slow_query_log_file to specify the name of the log file.
Slow Query Log Format
Here's what a typical slow query entry might look like:
root@server# tail /var/log/slowqueries# Time: 130320 7:30:26
# User@Host: db_user[db_database] @ localhost []
# Query_time: 4.545309 Lock_time: 0.000069 Rows_sent: 219 Rows_examined: 254
SET timestamp=1363779026;
SELECT option_name, option_value FROM wp_options WHERE autoload = 'yes';
The server will write less information to the slow query log if you use the --log-short-format option. Conversely, enabling the log_slow_extra system variable (available as of MySQL 8.0.14) will cause the server to write several extra fields to the log.
Enabling Slow Query Logging
The slow query log is disabled, so you have to turn it on by setting the --slow_query_log variable to 1 (ON in Navicat). Likewise, providing no argument also turns on the slow query log. An argument of 0 (OFF in Navicat) disables the log.
In Navicat, you can look up system variables using the Server Monitor tool. It's accessible via the Tools main menu command.
In the Server Monitor, click on the middle "Variables" tab and scroll down to see the slow_query_log and slow_query_log_file server variables in the list:
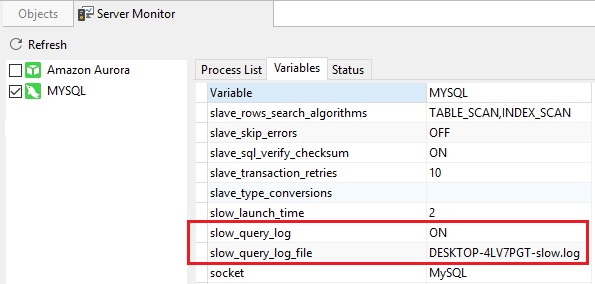
The slow_query_log server variables in the Navicat Server Monitor tool


