

Behind the slick User Interface (UI) of modern web applications, there are asynchronous services fetching data from the database with a multitude of objectives, including loading drop-downs, populating data tables, Synchronizing components, and many others. Any lagging of the back-end processes will be perceived by the user as a slow or even a non-responsive application. This in turn degrades the user experience and sours their opinion of your application. For that reason, it is imperative that you whittle down your query response time to the lowest feasible value. In many cases, this means measuring query turn-around in hundreds of a second, as opposed to seconds.
Needless to say, achieving sub-second response times takes some doing beyond defining indexes on searchable fields. In today's blog, we'll take a look at some techniques for making your queries maximally performant in MySQL 8.
The EXPLAIN Command
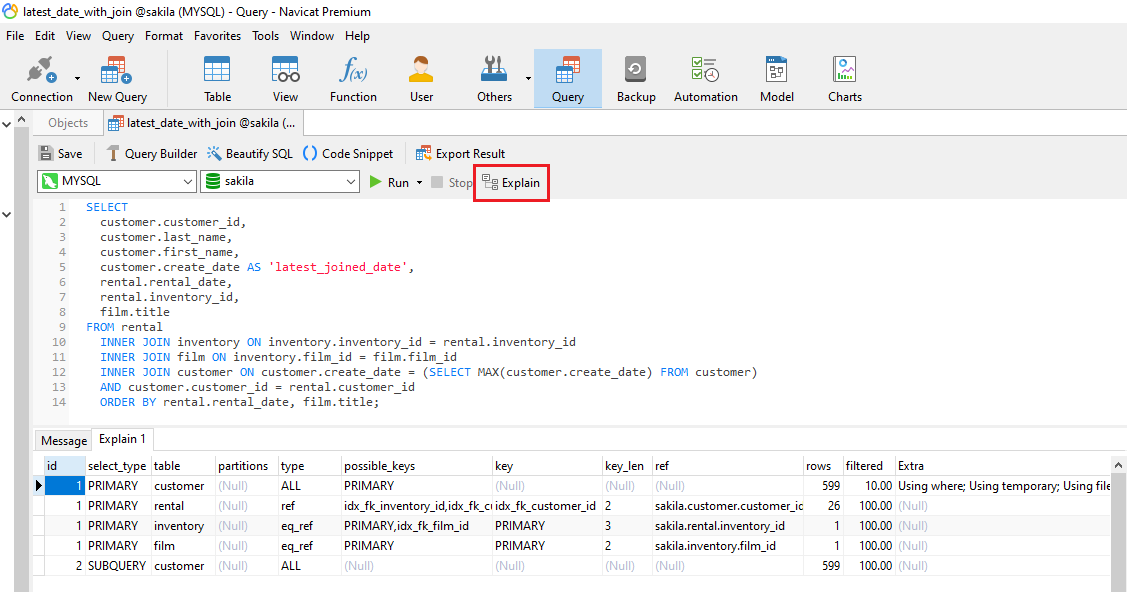
A good way to see what a query needs in order to perform better is to use the EXPLAIN command. It returns a formatted description of the query optimizer's execution plan for the specified statement. You can use this information to analyze and troubleshoot the query.
By default, EXPLAIN output represents the query plan as a hierarchy whereby each level represents a single database operation that the optimizer defines to execute the query. It takes a bit of practice to get accustomed to EXPLAIN's output, but the more you do it, the better you'll get understanding where your queries need tweaking.
In Navicat for MySQL, there's a button in the SQL Editor that runs EXPLAIN for me. Results are displayed in an easy-to-read grid format:
Query Profiling
You can use query profiling to measure query execution time. Here's how do to that in MySQL:
- Start the profiler with:
SET profiling = 1;
- Then execute your query with:
SHOW PROFILES;
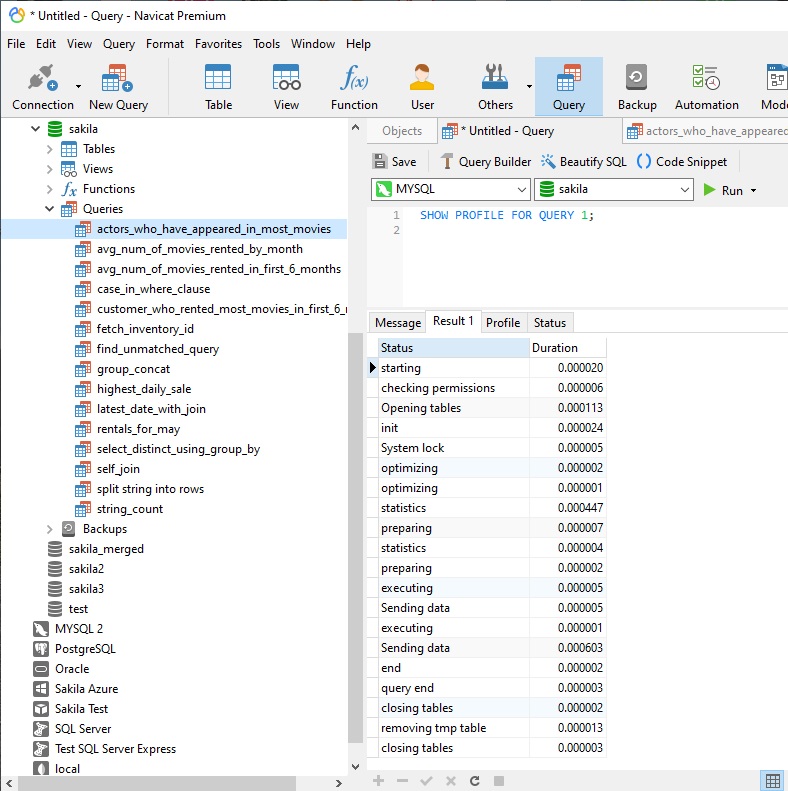
- You'll then see a list of queries the profiler has statistics for. Choose which query to examine with the statement:
SHOW PROFILE FOR QUERY 1;
...or whatever number is assigned to your query.
You'll then get is a list where exactly how much time was spent during the query:
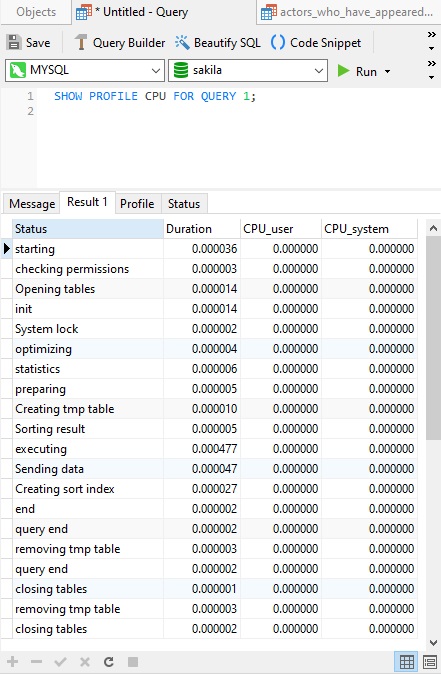
You can also get a profile of CPU usage:
Analyzing Query Performance using a Navicat Monitor
Navicat Monitor is an agentless remote server monitoring tool that is packed with powerful features to make your monitoring effective as possible. It works with MySQL, MariaDB and SQL Server, as well as cloud databases like Amazon RDS, Amazon Aurora, Oracle Cloud, Google Cloud and Microsoft Azure. The Query Analyzer screen shows information of all executing queries. You can use it to further analyze and evaluate your query performance:
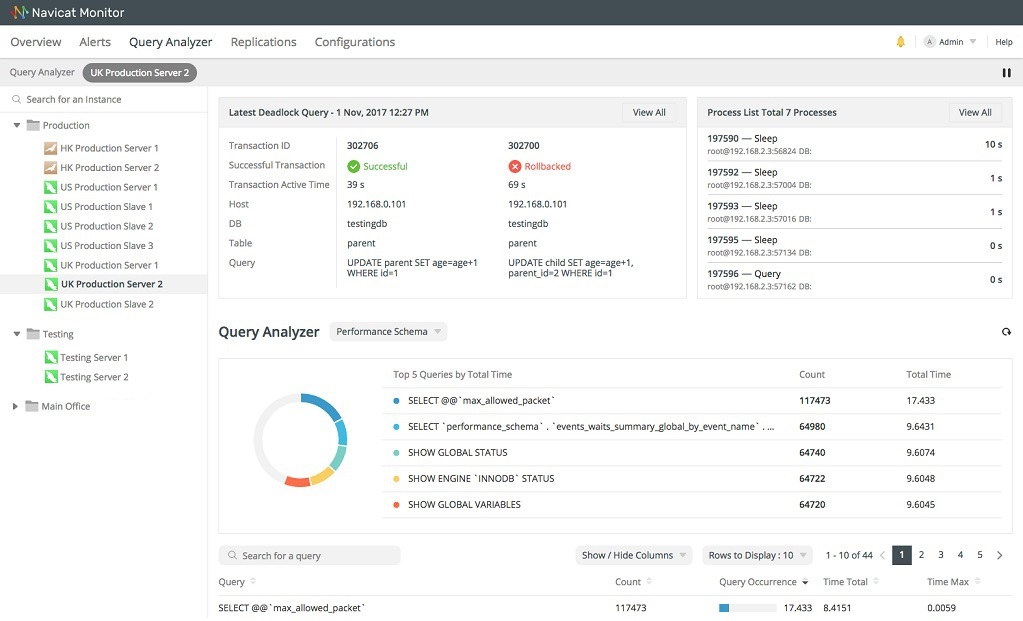
The screen is divided into several sections:
- Latest Deadlock Query: Shows the transaction information of the latest deadlock detected in the selected instance.
- Process List: Displays the total number of running processes for the selected instance, and lists the last 5 processes including ID, command type, user, database and time information.
- Query Analyzer: Displays information about query statements with customizable and sortable columns.
Conclusion
In today's blog, we'll take a look at some techniques for making your queries as expeditious as possible in MySQL 8.
Interested in Navicat Monitor? You can try it for 14 days completely free of charge for evaluation purposes!


