

Navicat Monitor, the agentless database server instance monitoring tool for MySQL and MariaDB recently added support for SQL Server. Hence, it can now monitor database process and system resources for locally hosted SQL Server instances as well as those provided via Amazon Web Services (AWS). Today's blog will provide a quick guide for connecting to an SQL Server instance in order to monitor its performance using Navicat Monitor 2.0.
Connecting to an SQL Server Instance
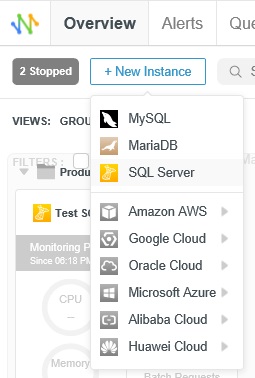
To start monitoring an SQL Server instance, you have to configure the connection via the New Instance button. You'll see the new SQL Server item in the list. It will allow you to connect to both locally hosted SQL Server instances as well as those provided via Amazon Web Services (AWS):
The New Instance dialog states the database type now, i.e "New SQL Server Instance", rather than the generic "New Instance" title of previous Navicat Monitor versions. While the fields and options are laid out using a very similar layout between databases, closer inspection reveals that they are tailored to the specific type of database chosen, in this case, SQL Server:
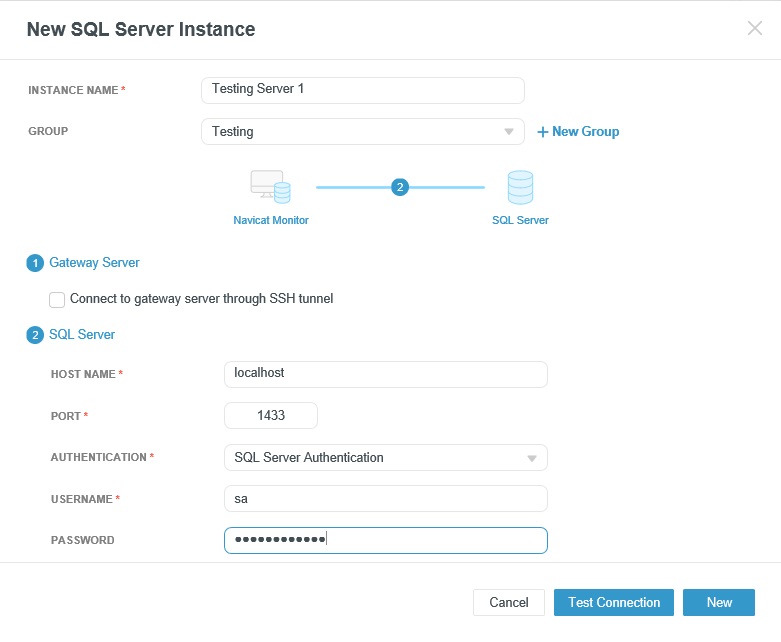
Note that the Host Name defaults to "localhost". You can change it to your instance server name, and that includes that of an AWS instance, i.e. "sample-instance.abc2defghije.us-west-2.rds.amazonaws.com". In that way, both local and remote connections are fully supported.
For more information on connecting to your database instance(s), take a look at the Configure an Instance in Navicat Monitor for MySQL/MariaDB blog article.
The Dashboard
To accommodate SQL Servers, there is a new SQL Server Filter in the Filters bar. Filters allow you to only show database instances of the selected type(s):
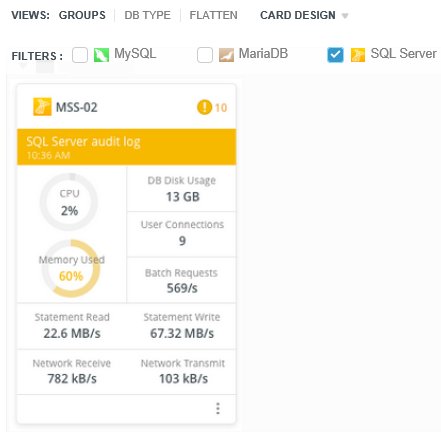
All of the Dashboard functionality and features remain unchanged. You can still sort by Alert Severity, Name, or Instance Type, and instance cards may still be dragged from one Group to another using the handlebar.

You'll know that you can drag the card when the mouse pointer turns into an arrow:
You can choose exactly which metrics are displayed in the Instance Card by clicking on CARD DESIGN. The Card Design dialog metrics are now divided into two columns: one for MySQL/MariaDB and one for SQL Server:

Conclusion
In today's blog, we learned how the latest version of Navicat Monitor has evolved to support SQL Server.
Navicat Monitor version 2.0 is now available for sales at Navicat Online Store and is priced at US$499/token (commercial) and US$199/token (non-commercial). 1 token is needed to unlock 1 MySQL Server / 1 MariaDB Server / 1 SQL Server.
For more details on Navicat Monitor and all its features, please visit: https://www.navicat.com/en/discover-navicat-monitor.
You can download a fully functional 14-day free trial at https://www.navicat.com/en/download/navicat-monitor. Give it a try!


