

MySQL 5.5 saw the addition of the performance_schema and information_schema databases. As we saw in last week's blog, tables in information_schema contain statistical information about tables, plugins, partitions, processlist, status and global variables. As the name suggests, the tables of the performance_schema can be utilized to improve performance of our MySQL instances. Just how to do that will be the topic of today's blog. Just like last time, we'll be using Navicat Premium to demo the various queries.
A Brief Overview
The Performance Schema is a tool for monitoring MySQL Server execution at a low level. The Performance Schema's storage engine shared the "performance_schema" name in order to easily distinguish it from other storage engines. Having its own engine allows us to access information about server execution while having minimal impact on server performance. Moreover, it uses views or temporary tables so as to minimize persistent disk storage. Finally, memory allocation is all done at server startup, so there is no further memory reallocation or sizing, which greatly streamlines performance.
The Performance Schema is enabled by default as of MySQL 5.6.6. Before that version, it was disabled by default. You can verify its status using this statement:
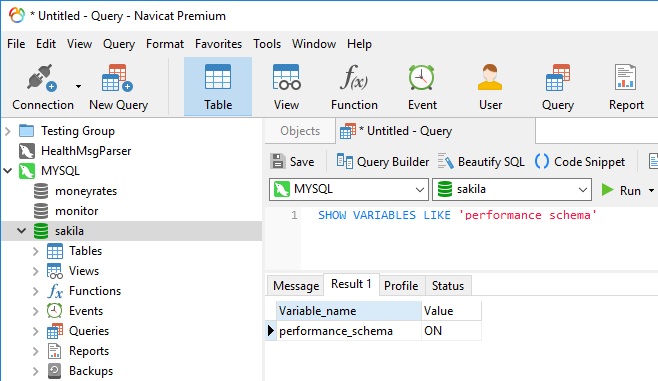
If you need to, you can always enable it explicitly by starting the server with the --performance-schema=ON flag.
Now let's get into some practical uses for the performance_schema.
A Crash Course on Mutexes and Threads
A mutex is a synchronization mechanism used in the code to enforce that only one thread at a given time can have access to some common resource. The resource is said to be "protected" by the mutex. The word "Mutex" is an informal abbreviation for "mutex variable", which is itself is short for "mutual exclusion". In MySQL, it's the low-level object that InnoDB uses to represent and enforce exclusive-access locks to internal in-memory data structures. Here's how it works:
Once the lock is acquired, any other process, thread, and so on is prevented from acquiring the same lock. In InnoDB, multiple threads of execution access shared data structures. InnoDB synchronizes these accesses with its own implementation of mutexes and read/write locks. When two threads executing in the server (for example, two user sessions executing a query simultaneously) need to access the same resource, such as a file, a buffer, or some piece of data, these two threads will compete against each other, so that the first query to obtain a lock on the mutex will cause the other query to wait until the first is done and unlocks the mutex. Should the first thread take a long time to complete, it can thus hold up other processes.
Some Useful Queries
All of the mutexes are listed in the mutex_instances table of the Performance Schema, which can be extremely helpful in investigating performance bottlenecks. The mutex_instances.LOCKED_BY_THREAD_ID and rwlock_instances.WRITE_LOCKED_BY_THREAD_ID columns are extremely important for investigating performance bottlenecks or deadlocks. Here's how to use them:
Suppose that thread 1 is stuck waiting for a mutex.
You can determine what the thread is waiting for:
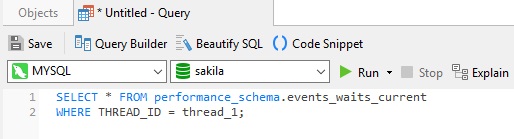
Say the query result identifies that the thread is waiting for mutex A, found in events_waits_current.OBJECT_INSTANCE_BEGIN.
You can determine which thread is holding mutex A:

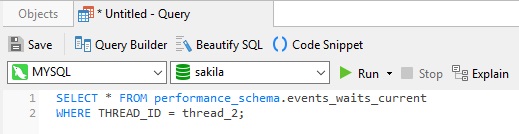
Say the query result identifies that it is thread 2 holding mutex A, as found in mutex_instances.LOCKED_BY_THREAD_ID.
You can see what thread 2 is doing using this query:
Conclusion
In today's blog, we learned how to use the Performance Schema to diagnose bottlenecks and/or deadlocks in MySQL 8. An even easier way is to use Navicat Monitor. It has a Query Analyzer that shows the summary information of all executing queries and lets you easily detecting deadlocks, such as when two or more queries permanently block each other. We'll explore that next time.


