

With so many factors to consider, uncovering the root cause(s) of slow query execution takes an organized approach. Luckily, with a bit of effort, you can pin down an issue to one of the more common culprits by checking up on a few things. In today's blog, we'll learn how Navicat Monitor 2 can help you get the the bottom of slow query execution - fast!
Network Issues
Database servers are designed to be accessed over a network, be it an internal or external one, like the World-wide Web. As such, the occasional dropping of a connection, or even outages that last for hours or days are to be expected, on occasion. Good performance in a local environment is a promising sign, but isn't necessarily enough to exclude network issues entirely, as the server itself could be overloaded. You can test for that using a monitoring tool that can track server OS metrics like CPU processes and memory. That's where Navicat Monitor can help, by tracking O/S metrics.
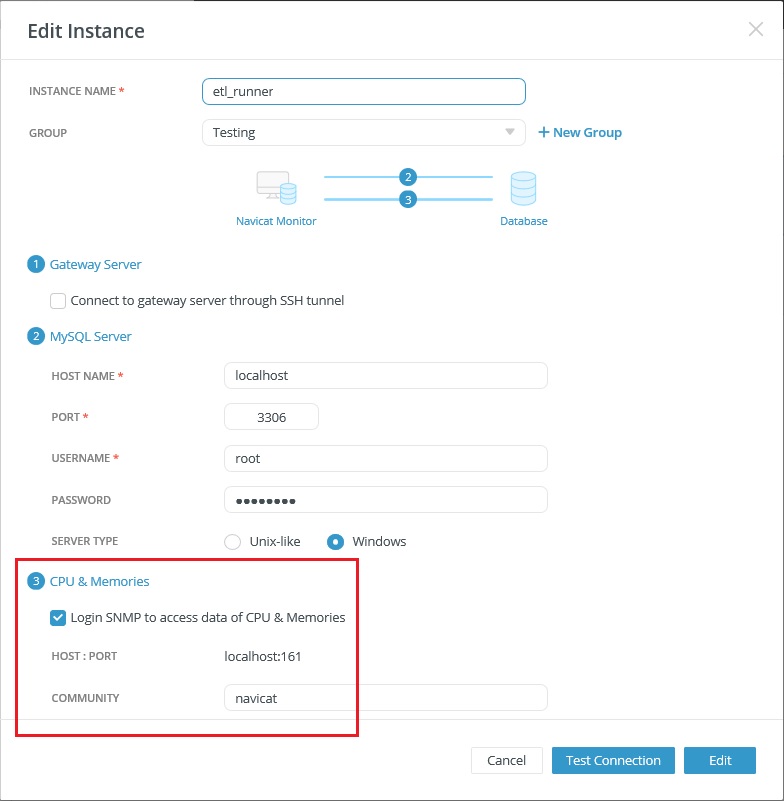
On Windows Type servers, you can configure CPU & Memories section to monitor O/S metrics over Simple Network Management Protocol (SNMP):
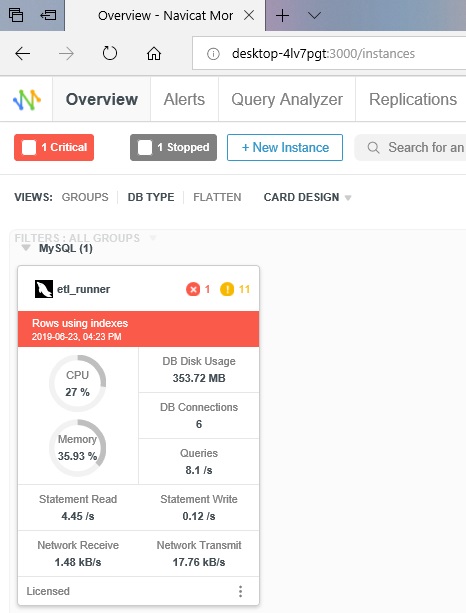
Doing so will cause server metrics like CPU, Memory, and Disk Usage to appear in Dashboard Instance Cards:
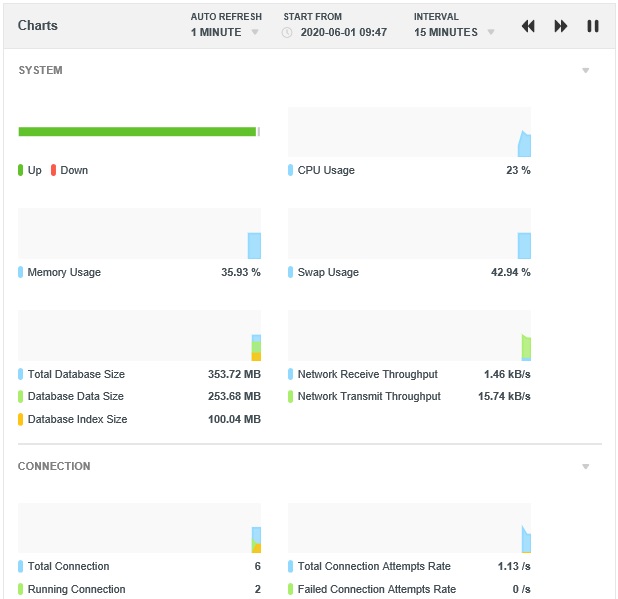
You can also click on the system metrics to see more details, including Swap Usage, Connections, and Network Throughput. Each metric includes an interactive chart:
Query Monitoring
Once you've ruled out network issues, it's time to take a closer look at the query itself. A query can be functionally correct in that it fetches the correct data, but still be deficient by doing so in an efficient manner. It's essential to design your queries in such a way as to maximize efficiency because, depending on the database engine, all queries are likely to be run sequentially as a queue. Case in point MySQL's MyISAM engine acquires a table level lock when executing queries in order to protect data integrity during transactions. During that time, other processes/queries must wait their turn while the first query completes. If it's a stalwart, that wait could wind up being a long one!
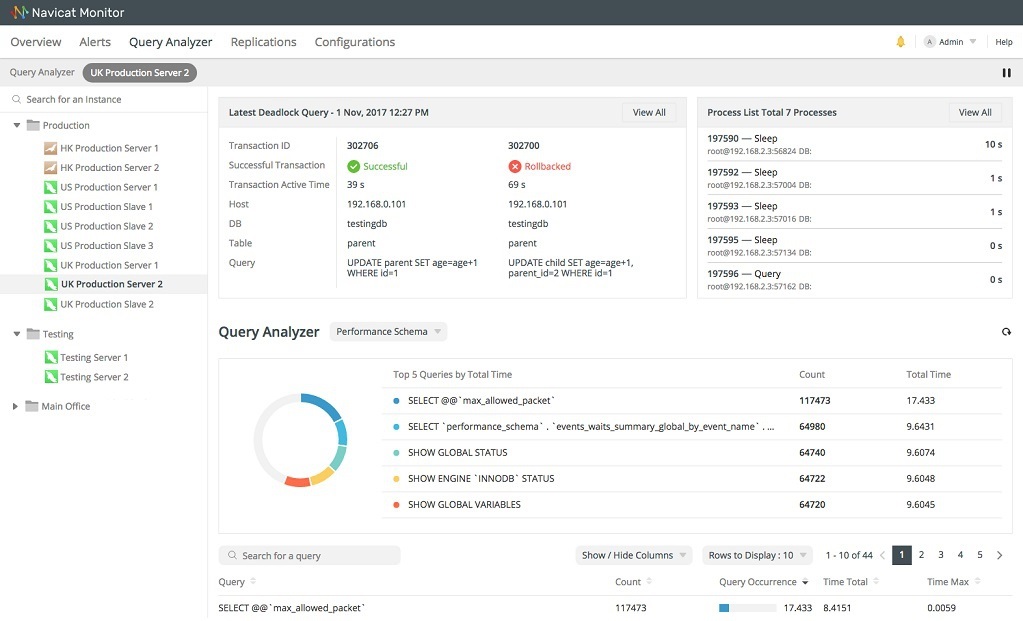
Navicat Monitor's Query Analyzer screen to be very helpful in this regard. It shows the summary information of all executing queries and lets you spot problematic queries, including:
- top queries with cumulative execution time count
- slow queries with unacceptable response time
- deadlocks (when two or more queries permanently block each other)
Conclusion
In today's blog, we learned how Navicat Monitor 2 can help you get the the bottom of slow query execution - and fast!
Navicat Monitor is a safe, simple and agentless remote server monitoring tool for MySQL, MariaDB and SQL Server. It includes a rich set of real-time and historical graphs that allow you to drill down into server statistic details. The latest release of Navicat Monitor (version 2.0) now supports SQL Server as well!
Navicat Monitor version 2.0 is now available for sales at Navicat Online Store and is priced at US$499/token (commercial) and US$199/token (non-commercial). 1 token is needed to unlock 1 MySQL Server / 1 MariaDB Server / 1 SQL Server.
Click here for more details about all of Navicat Monitor's features, or, download the 14-day fully functional free trial!


