

Navicat Monitor is a safe, simple and agentless remote server monitoring tool that is packed with powerful features to make your monitoring effective as possible. Monitored servers include MySQL, MariaDB, PostgreSQL and SQL Server, and compatible with cloud databases like Amazon RDS, Amazon Aurora, Oracle Cloud, Google Cloud and Microsoft Azure.
Navicat Monitor is a server-based software which can be accessed from anywhere via a web browser. With web access, you can easily and seamlessly keep track of your servers around the world, around the clock.
Real-time Performance Monitoring
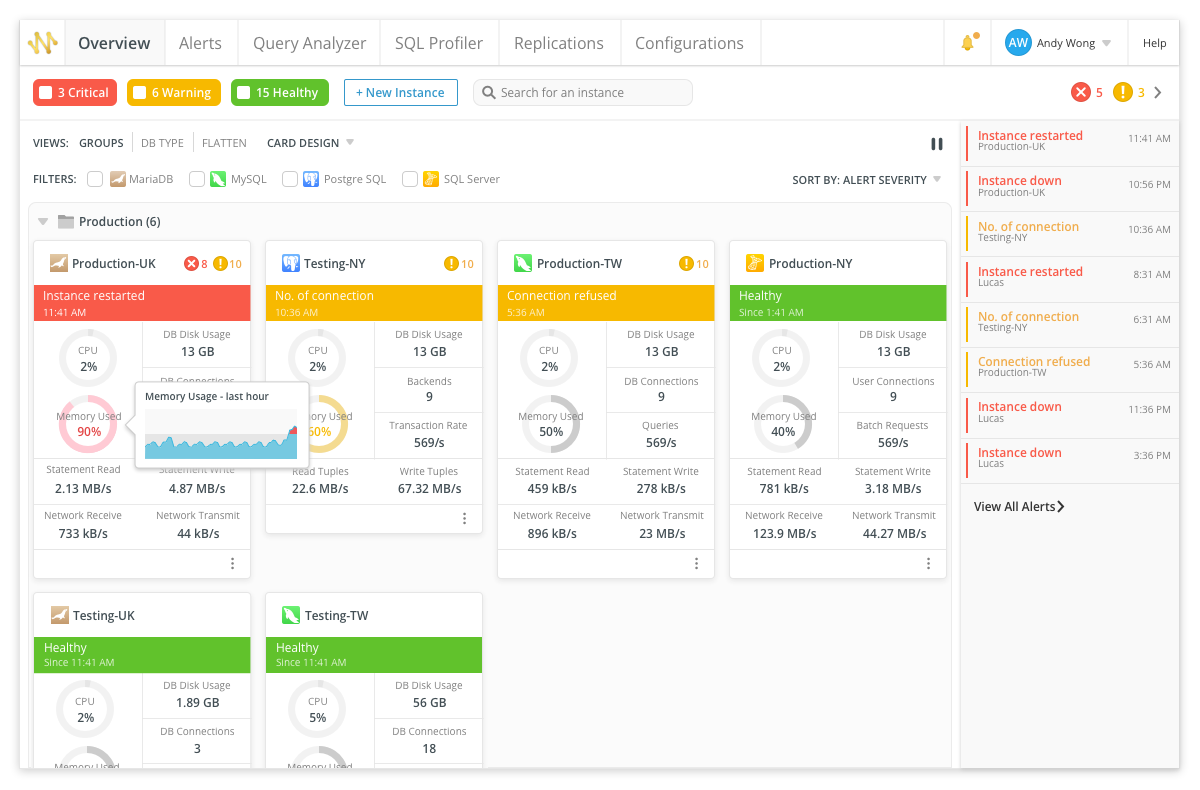
Navicat Monitor includes a rich set of real-time and historical graphs that allow you to drill down into server statistic details. It gives you a detailed view of each server load and performance regarding its availability, disk usage, network I/O, table locks and more, which allows you to easily track the deviations and traffic among servers, as well as examine possible solutions and adjust your server settings.
Dashboard - get summary in one place
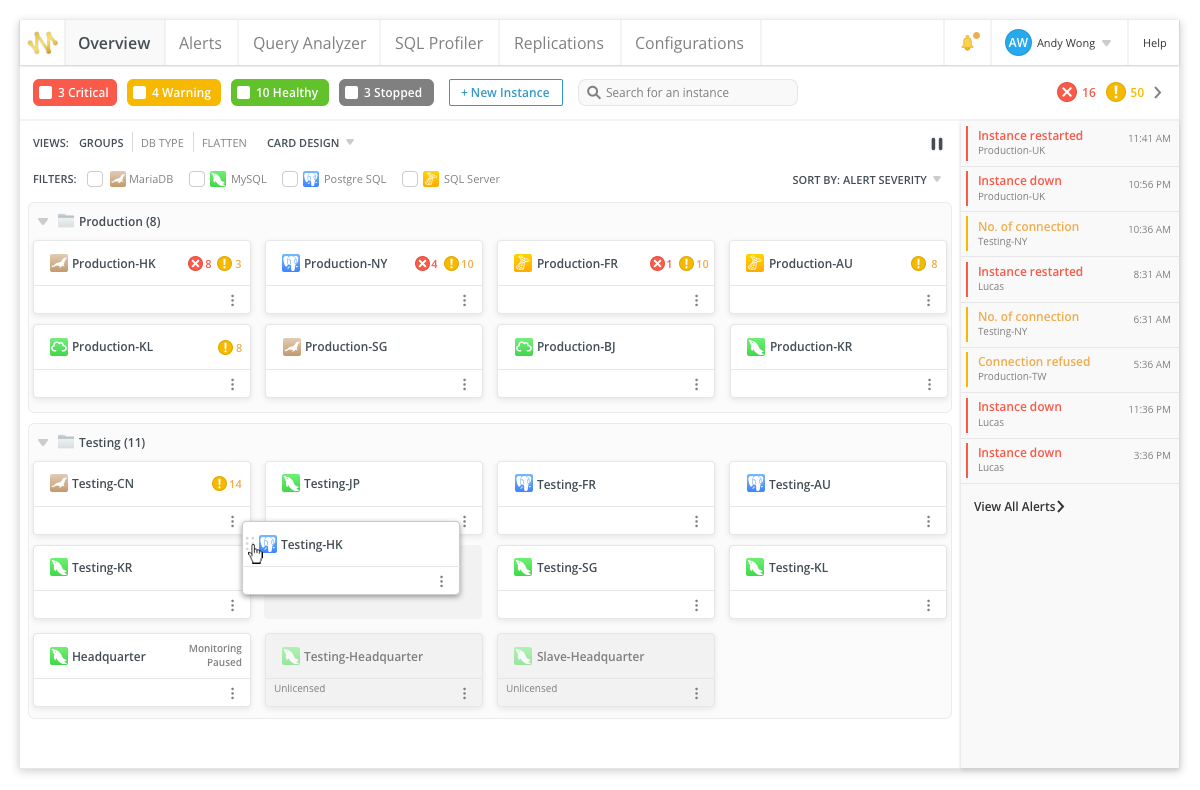
Our interactive dashboard lists all the monitored instances and allows you to easily see how your instances are currently functioning. It also gives you an overview of the performance, availability and health of each instance.
Status and Performance Charts
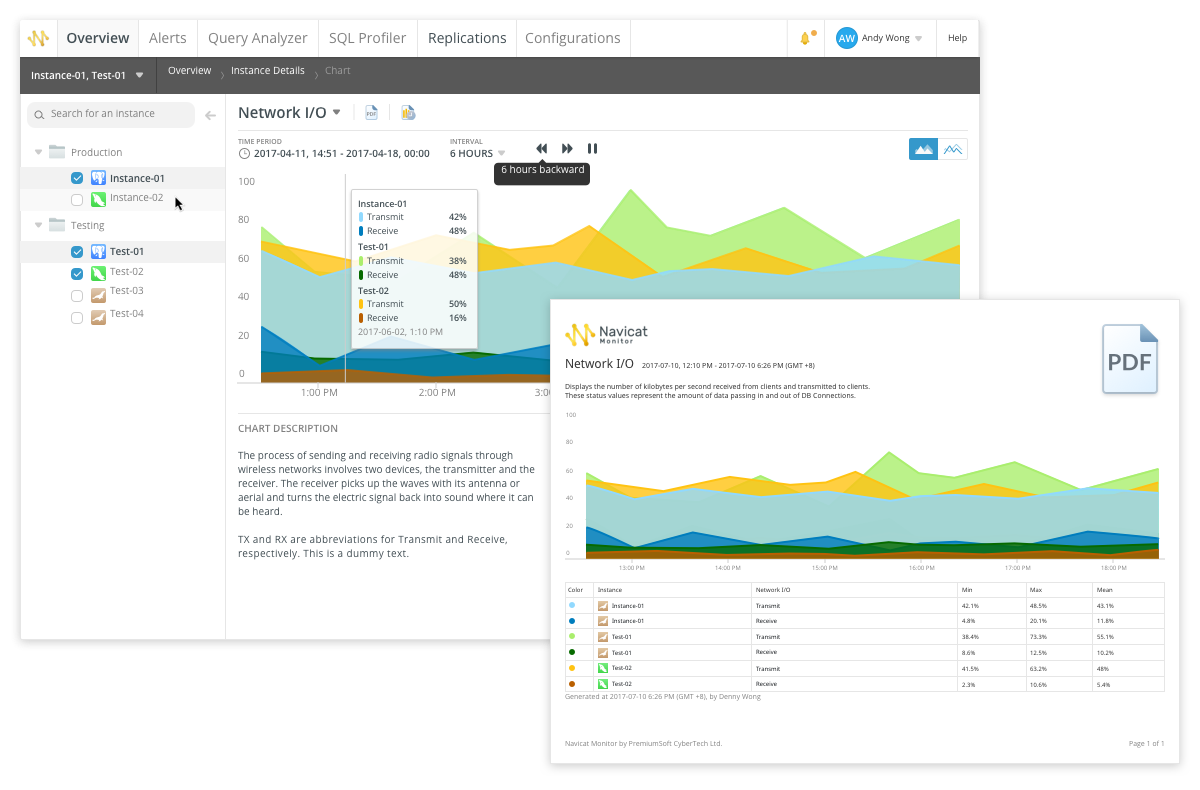
Collect metrics of multiple instances on the same chart to compare and analyze data at incredible speed. You can also save your chart as a high-quality PDF document with one click.
Replication
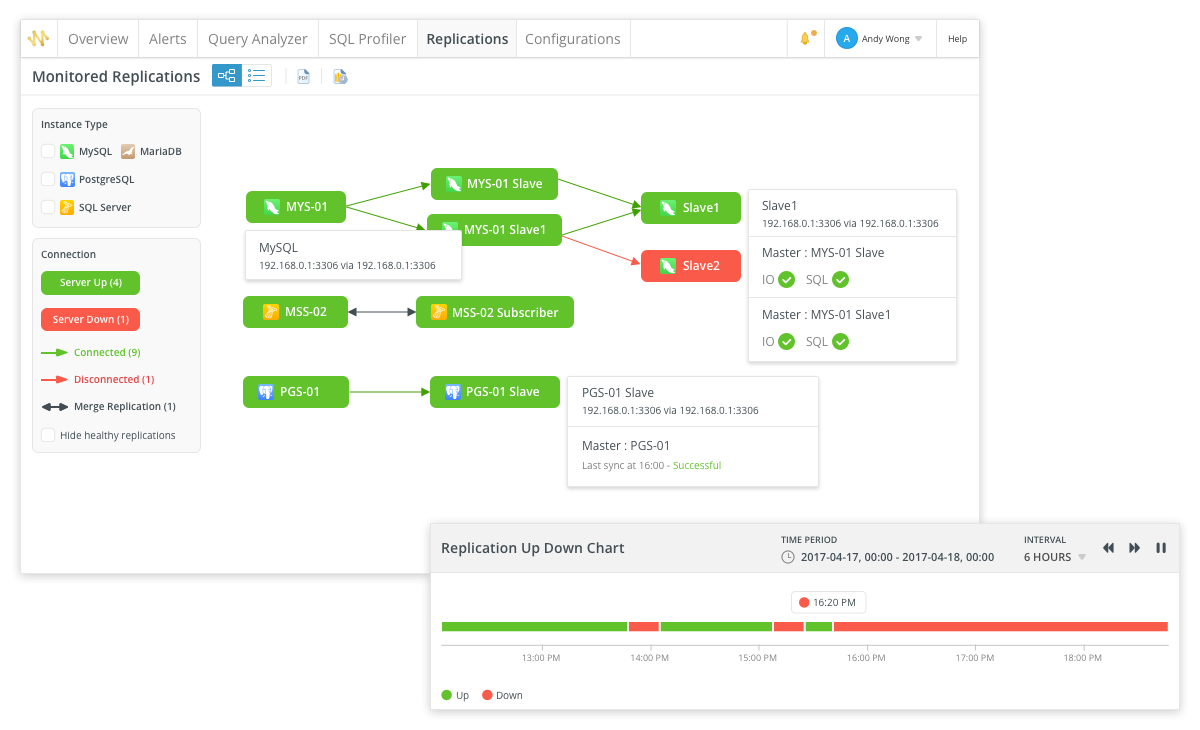
Apply schematic diagrams to visually represent the replication relationships. You can monitor the overall health of a replication topology as a whole, each individual node, and each replication subsystem to make sure the data on the replicated servers is always up to date.
Custom Metrics
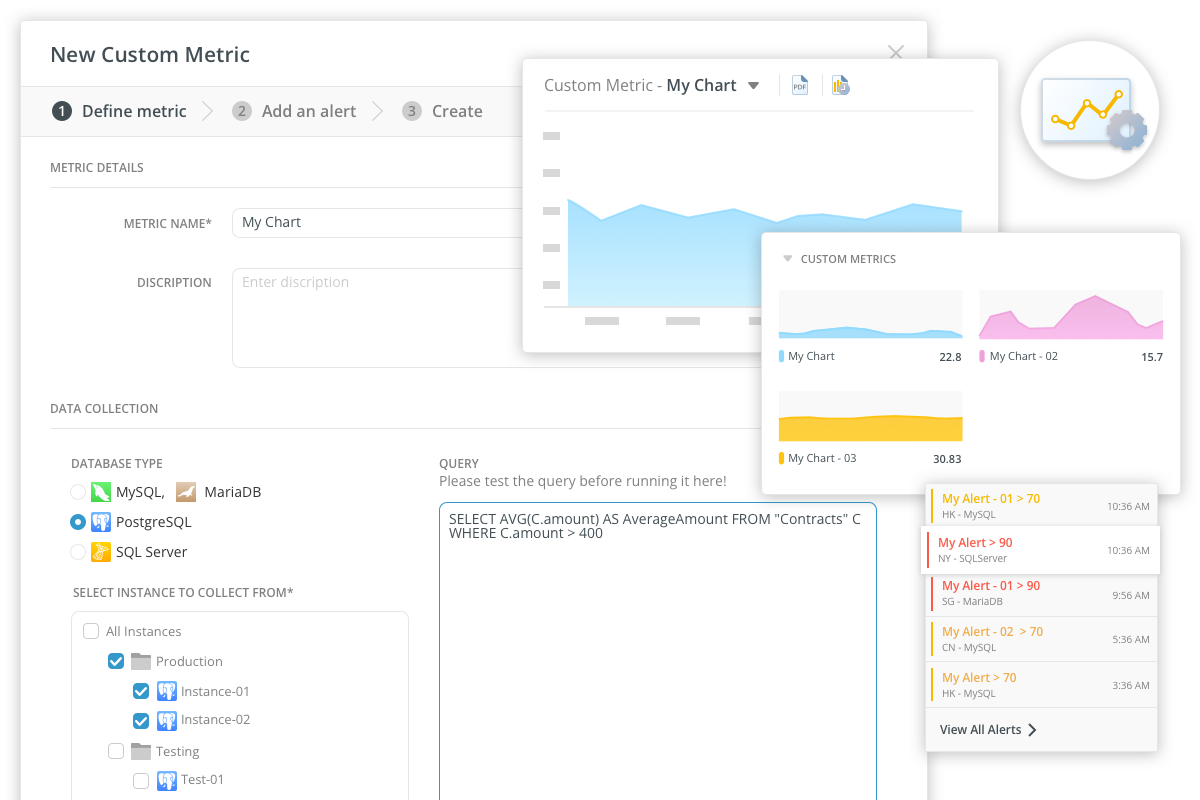
Write your own query to create custom charts for capturing arbitrary metric data. You can easily define your custom metrics and set alerts to analyze and monitor your server.
Scheduled Reports
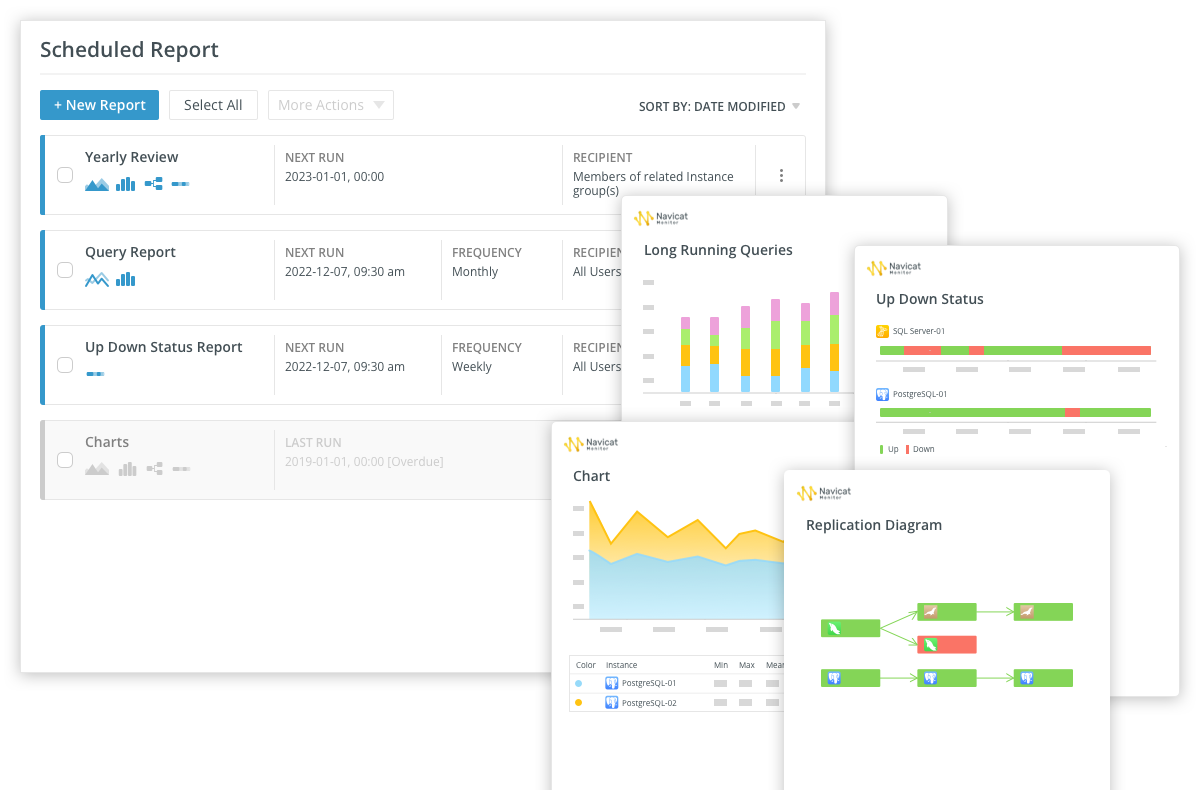
Set up the report to run at specific intervals, and schedule it to be emailed to multiple recipients in PDF format. Your emailed reports will dynamically include new response data and any update your server had changed.
Query Analyzer
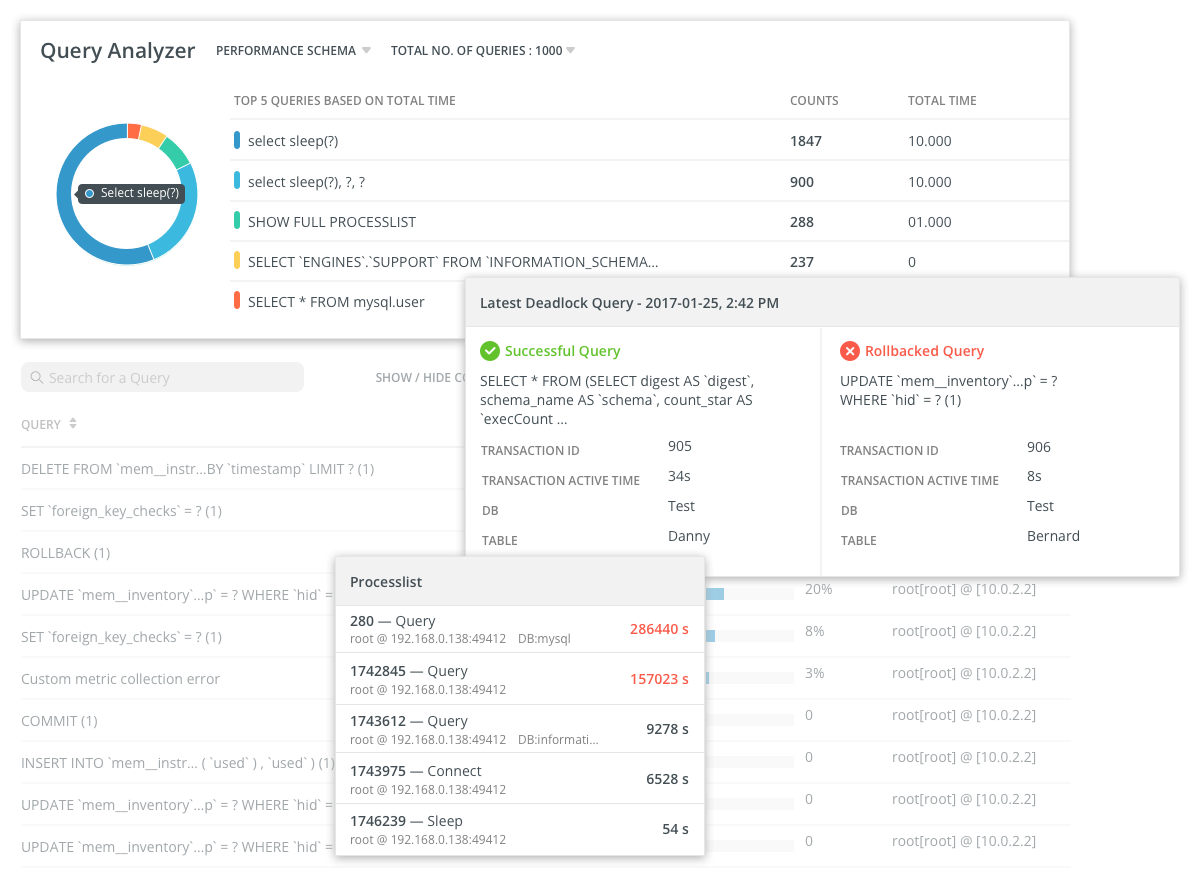
Monitor your queries in real time to quickly improve the performance and efficiency of your server. This powerful Query Analyzer shows the summary information of all executing queries and lets you easily uncover the problematic queries, such as identifying top queries with cumulative execution time count, slow queries with unacceptable response time, and detecting deadlocks when two or more queries permanently block each other. Navicat Monitor summarizes queries smartly so you get to see how many and which types of query are causing trouble.
Long Running Queries
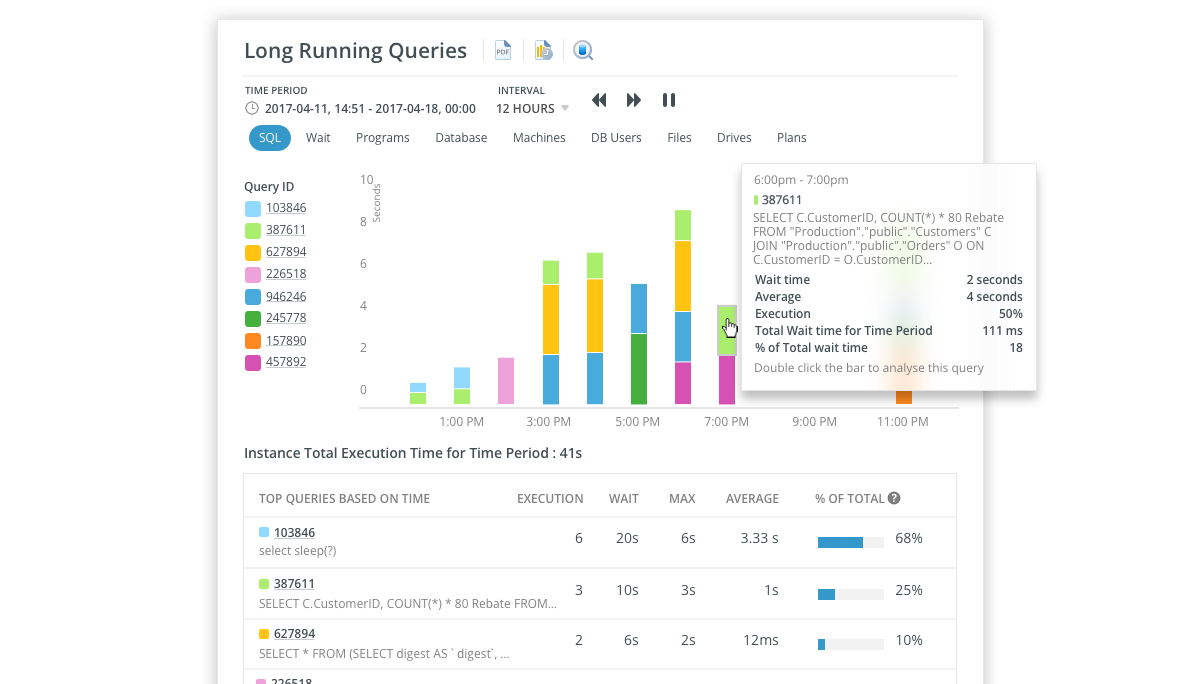
Track the history of the performance of a query over time, and display all queries with the longest wait times. Analyze and understand the evolution of each individual query. You can further troubleshoot the query and find out what caused the high resources consumption.
SQL Profiler
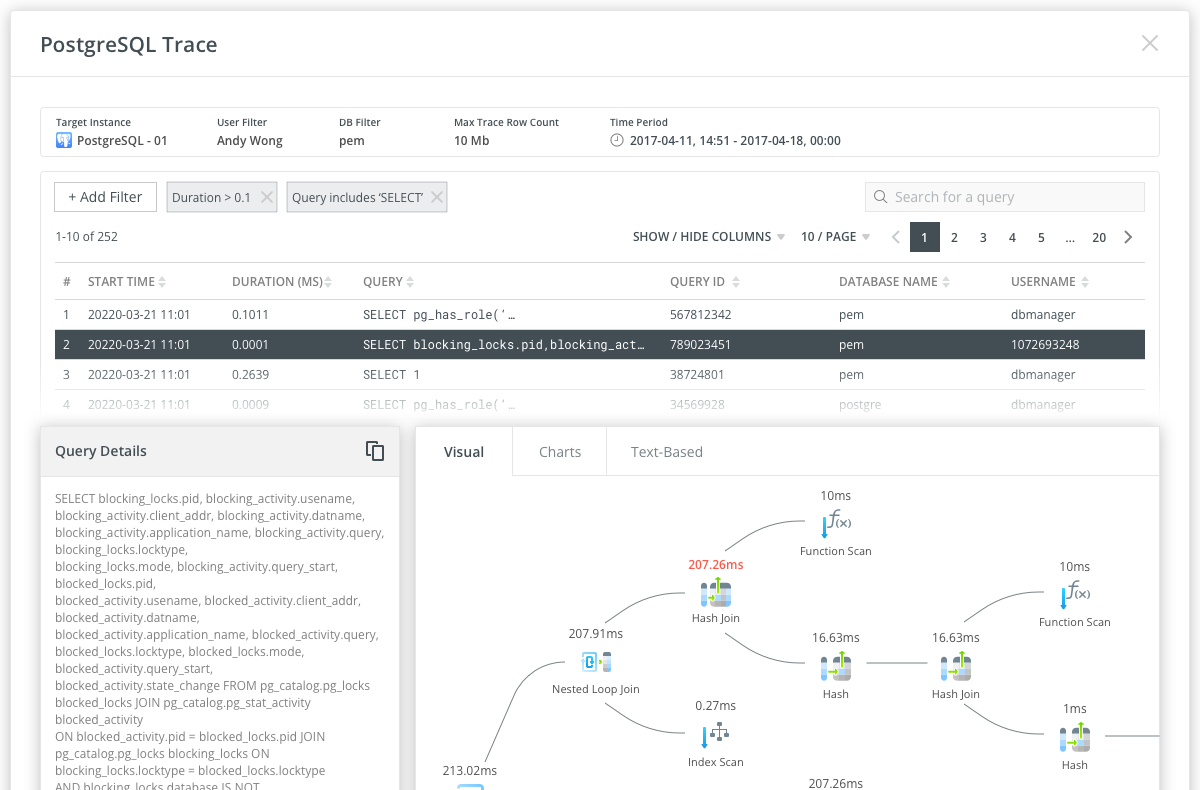
Provide graphical query execution details for locating inefficient and slow queries. You can create traces to collect data about the queries executed on an instance. The data can later be analyzed and used to troubleshoot performance issues.
Instances Management
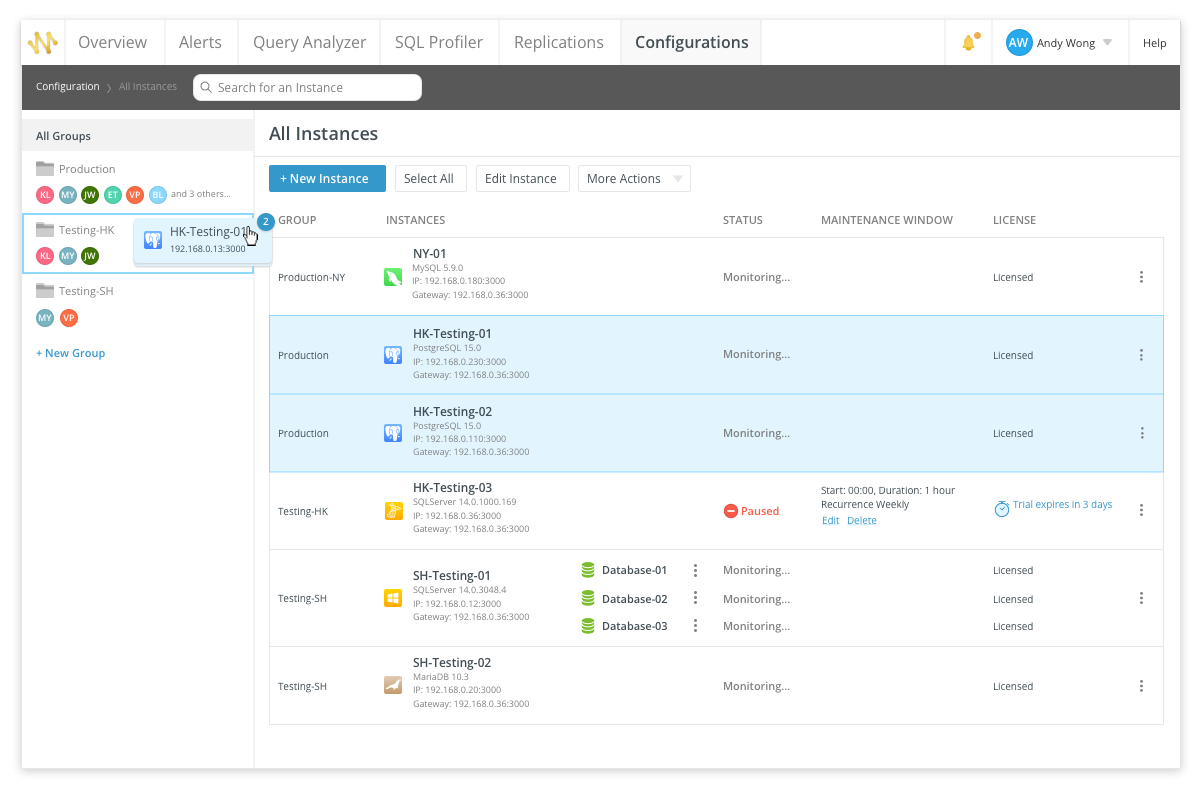
Organize your servers into groups to make it easier for users to find them by category. Assign users to specific groups as members and apply the same alert configuration settings to them effortlessly. All members will get notified when an alert is raised.
Alerts
Navicat Monitor provides advanced root cause analysis that enables you to drill down and find more in-depth information when an issue is found - server metrics, performance statistics, hardware usage, and historical data. You can also monitor your alerts in Alert Details, which provides an overview of the selected alerts that comprises its summary, timeline, metric charts, and more. With the build-in Alert feature, you can get notified before bigger problems arise to ensure your databases are constantly available and performing in an optimal manner.
Agentless Architecture
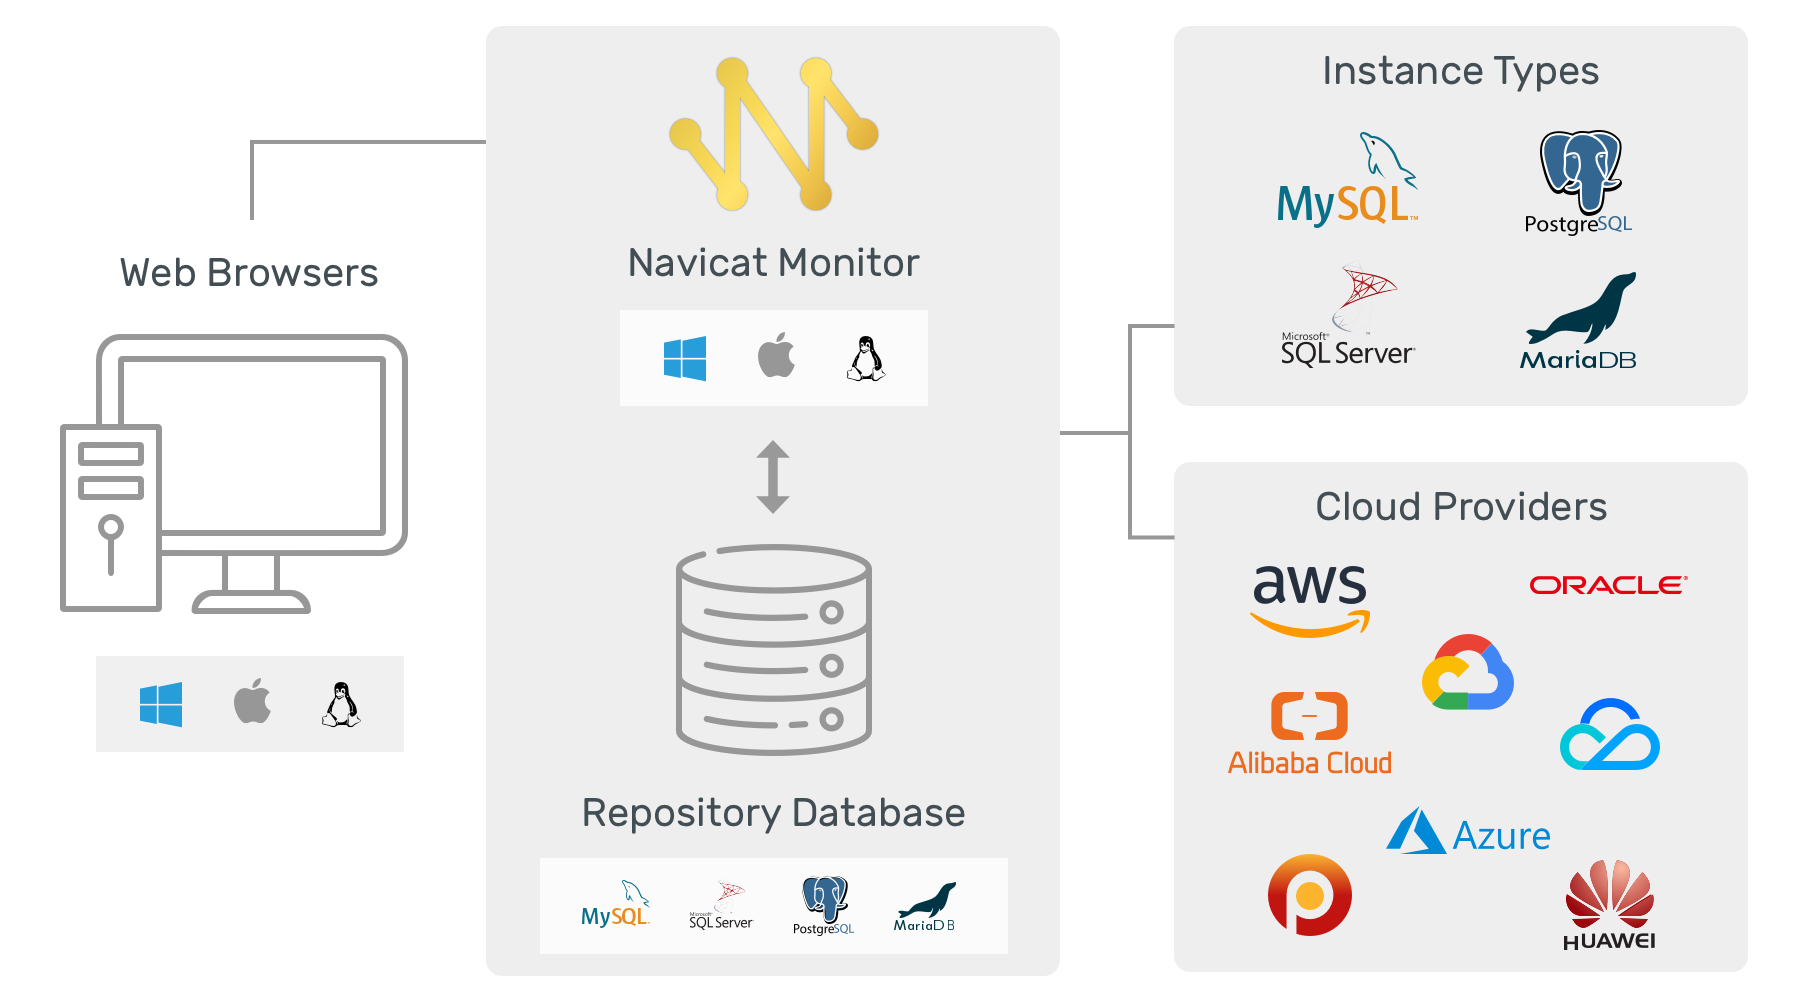
Navicat Monitor applies agentless architecture to monitor your MySQL, MariaDB, PostgreSQL and SQL Server, and collect metrics at regular intervals. It collects process metrics such as CPU load, RAM usage, and a variety of other resources over SSH/SNMP. Navicat Monitor can be installed on any local computer or virtual machine and does not require any software installation on the servers being monitored.
Navicat Monitor requires a repository to store alerts and metrics for historical analysis. The repository database can be an existing MySQL, MariaDB, PostgreSQL, SQL Server, or Amazon RDS instance.
Features

Alert Customization
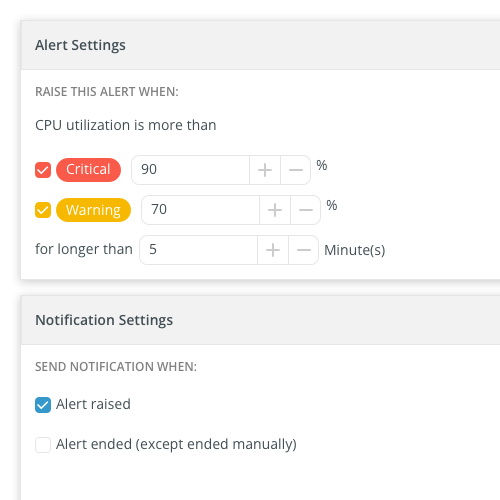
Set custom alert thresholds to monitor your infrastructure. Receive alerts when the threshold rules that you defined are reached. For example: when CPU utilization exceeds 90% for more than 30 minutes.

Notifications
Get notifications via email, SMS, SNMP or Slack whenever a warning or critical condition occurs in your infrastructure. Once notified, you can quickly diagnose and resolve your database issues.

LDAP/AD Authentication
Save time to set up a new and different security method by configuring Navicat Monitor to authenticate with LDAP server or Active Directory.

Roles Manager
Set up user access rights and restrictions by assigning roles to users. Roles can be mapped to any users like external LDAP/AD users or the local users created in Navicat Monitor. Customize the pre-defined roles to best fit your needs or create new roles with customized privileges settings to restrict access to selected pages in Navicat Monitor.

Migration
Export your Monitor settings if you wish to migrate your application server from one computer to another new machine. The output of the backup script will be a zip file with all required configuration files and settings for the restoration.

Dark Mode
Set dark theme to protect your eyes from the traditionally blinding whiteness of computer. No behavior changes with how pages look when you are in dark mode.


