

Overview, Latest Deadlock Query and Process List screens
As touched upon in the last blog series on the MySQL/MariaDB logs, one of the primary complaints levied by database administrators (DBAs) about the General and Slow Query logs is that their contents are difficult to read. The solution? Monitor your logs using Navicat Monitor for MySQL/MariaDB! Its Query Analyzer tool provides a graphical representation for the query logs that enables you to monitor and optimize query performance, visualize query activity statistics, analyze SQL statements, as well as quickly identify and resolve long running queries. Today's blog will provide an overview of this useful feature as well as describe how to take full advantage of the Latest Deadlock Query and Process List screens. Part 2 will be devoted to the Query Analyzer screen section.
The Query Analyzer at a Glance
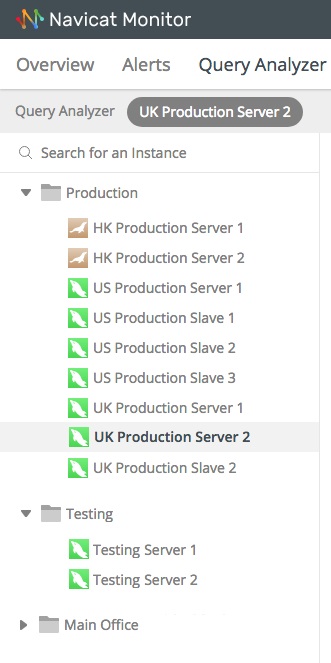
To start using Query Analyzer, select the instance that you want to analyze in the left pane:
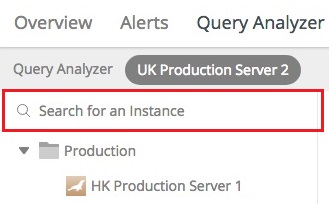
You can also narrow down the list to the instance you're looking for by entering the name in the Search field:
Upon selecting an instance, analysis begins immediately. After a short time, results of the analysis are displayed:
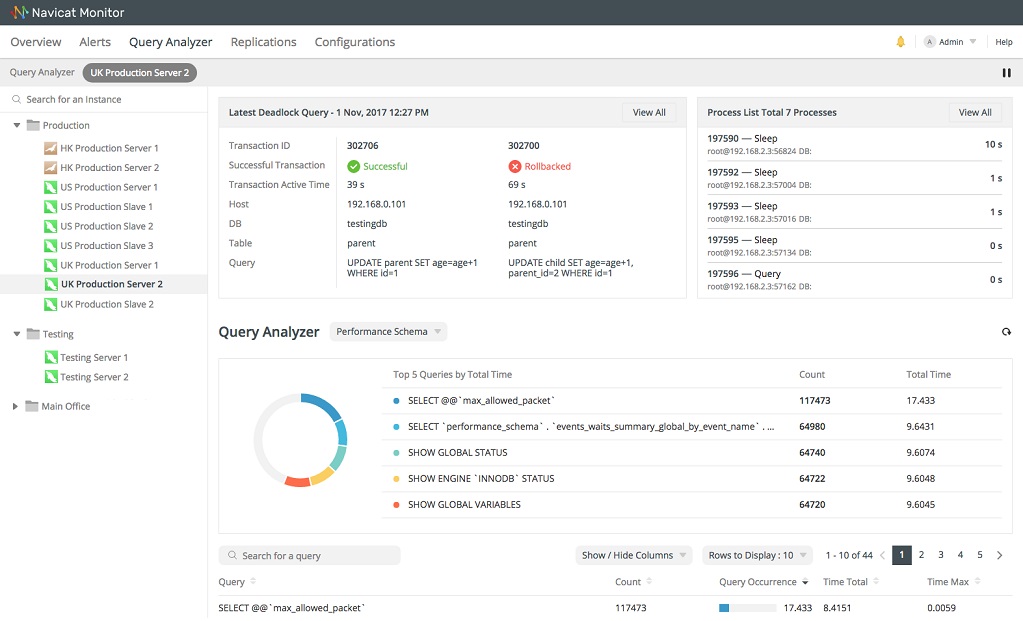
The screen is divided into the following sections:
- Latest Deadlock Query: Shows the transaction information of the latest deadlock detected in the selected instance.
- Process List: Displays the total number of running processes for the selected instance, and lists the last 5 processes including ID, command type, user, database and time information.
- Query Analyzer: Displays information about query statements with customizable and sortable columns.
The remainder of the blog will cover the first two sections above in more detail.
Latest Deadlock Query
If you'd like to see more than the latest deadlock, you can click the View All button. Doing so opens the Deadlock page. It displays all deadlocks detected on the selected instance:
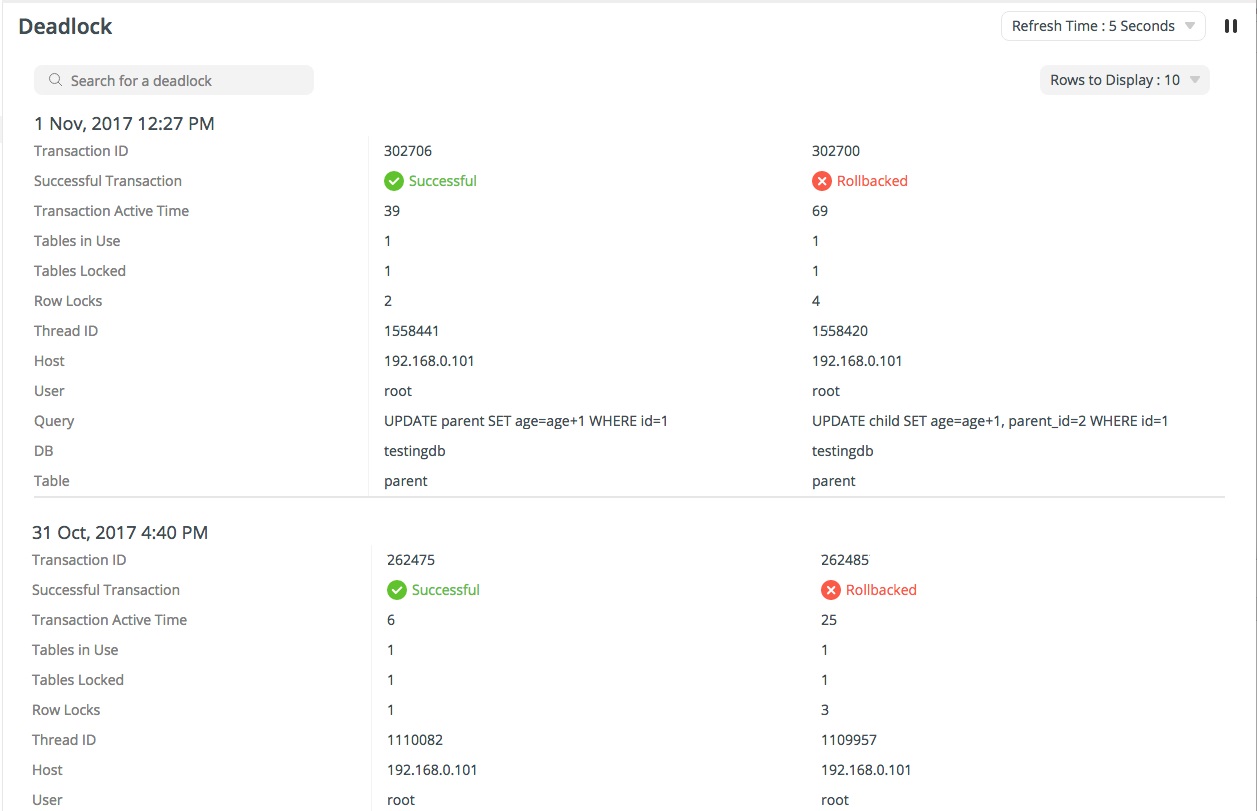
All monitored instances are shown in the left pane. Selecting an instance brings up deadlocks for that instance. You can filter the list by providing a value in the "Search for a deadlock" text box.
By default, the deadlock list refreshes every 5 seconds automatically. You can change the auto-refresh time using the Refresh Time drop-down menu. To pause the auto refresh, click the Pause button:
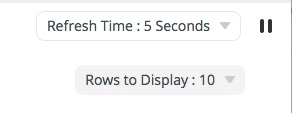
You can also set the number of rows to display via the Rows to Display drop-down menu.
Process List
You can click View All to view all processes.
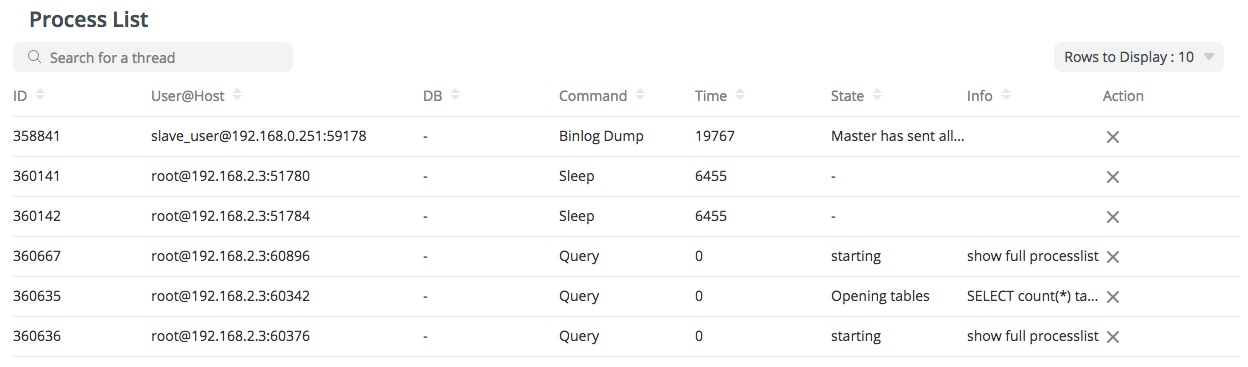
The Process List page displays all processes currently running on the selected instance. You can check which queries are currently being executed. The process list provides the following detailed information:
- ID: The thread ID.
- User@Host: The user who issued the statement.
- DB: The database that the user is currently used.
- Command: The type of command that the user issued.
- Time: The time in seconds that the thread has been in its current state.
- State: The state that indicates what the thread is doing.
- Info: The statement that the user issued.
As with Deadlocks, all monitored instances are shown in the left pane, where you can select an instance to show its process list. Also like deadlocks, the process list refreshes every 5 seconds automatically. It also includes a Refresh Time drop-down menu to change the auto-refreshing time. Clicking the Pause button pauses auto refreshing.
The list of threads can be filtered and sorted. Simply enter a search string in the Search for a thread box to filter the list and click the column name to sort the list. Moreover, clicking on Rows to Display and selecting a predefined number changes the number of threads shown per page.
Terminating a Process
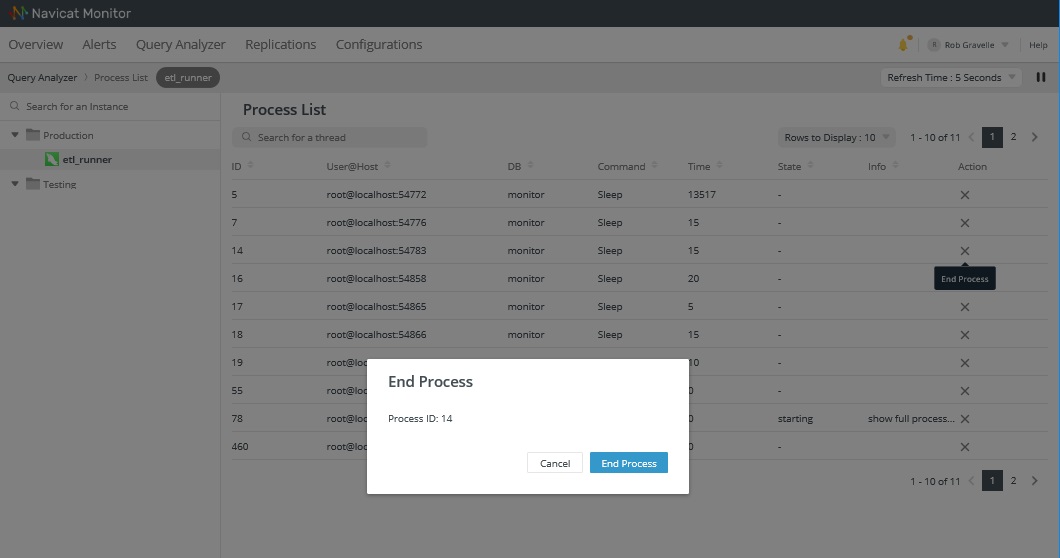
In additional to showing you currently running processes, you can stop a thread instantly by clicking in the Action column, and then clicking "End Process" in the pop-up dialog:
Thinking about purchasing Navicat Monitor for MySQL/MariaDB? It's now available via monthly and yearly subscription!


