

One of the main roles of database monitoring is to catch potential issues before they develop into real problems. To that end, Navicat Monitor for MySQL/MariaDB offers advanced root cause analysis that enables you to find in-depth information when an issue occurs. This functionality is part of the Alerts feature.
The Alert Details screen provides an overview of the selected alerts that comprises its summary, timeline, metric charts, and more. Navicat also maintains an Alerts History that you can browse through the alert table, open a particular alert, assign it to a user, or select multiple alerts at a time.
But perhaps Navicat Alerts' most useful feature is being able to notify you via email, SMS, SNMP or Slack whenever a warning or critical condition occurs in your infrastructure. In today's tip, we'll learn how to setup a custom alert.
Setting Alert Policies
In Navicat Monitor for MySQL/MariaDB, you can set custom alert thresholds to monitor your infrastructure and receive alerts when the threshold rules that you defined are reached. For example: when CPU utilization exceeds 90% for more than 30 minutes. You can also customize thresholds to trigger alerts for specific instances and groups, and set sending alert notifications to whom.
Alert is triggered when a monitored metric value crosses a specified threshold for a certain duration. You can enable or disable alerts and change their thresholds as well as inherit settings. To configure the alert policy, go to Configurations > Alert Policy.
The Alert Type table displays all available alerts and their details. There are three types of alerts: System, Security and Performance.
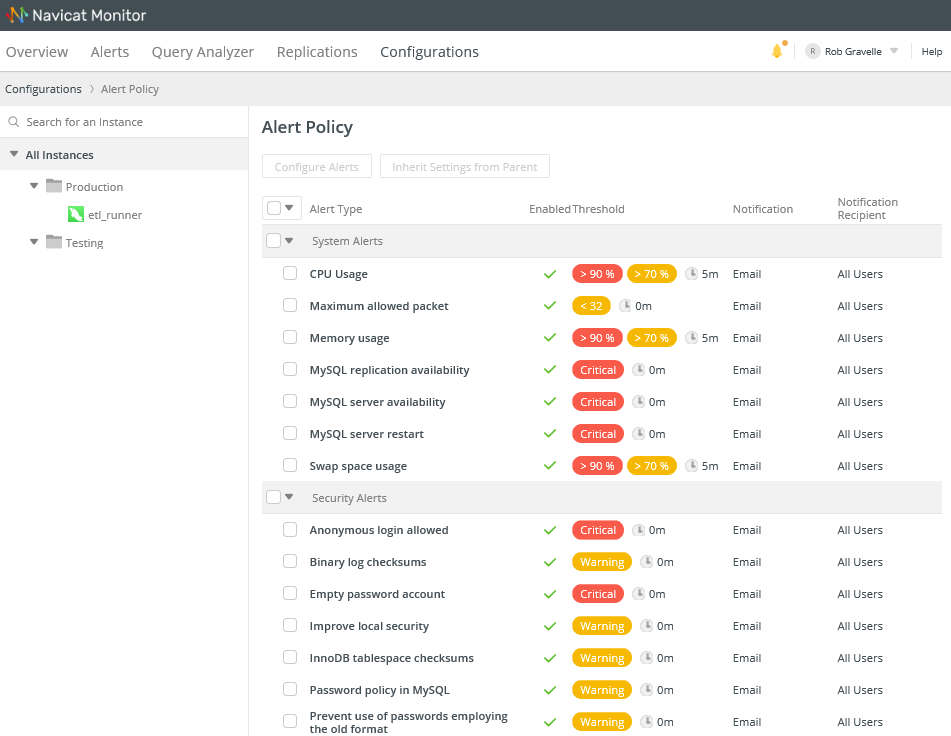
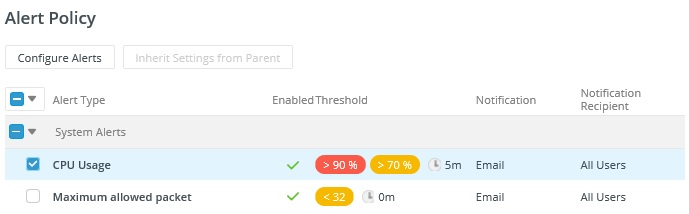
If we wanted to enable alerts for CPU Usage, we would click the "CPU Usage" label in the table row. (You can also configure multiple alerts simultaneously by checking the box beside each Alert and then clicking the "Configure Alerts" button.)
You can see that Navicat provides default values for each Alert. For instance, the CPU Usage Alert defines a warning condition at 70% of capacity, and a critical condition at 90%. Moreover, a threshold is triggered when either a warning or critical condition lasts for a minimum of 5 minutes. When triggered, an email notification is sent to All Users of the database.
All of these parameters may be changed on the CPU Usage details screen:
Let's say that we wish to raise our threshold values and send emails to the DBAs after a warning or critical condition exists for ten minutes, we could modify the alert details as follows:
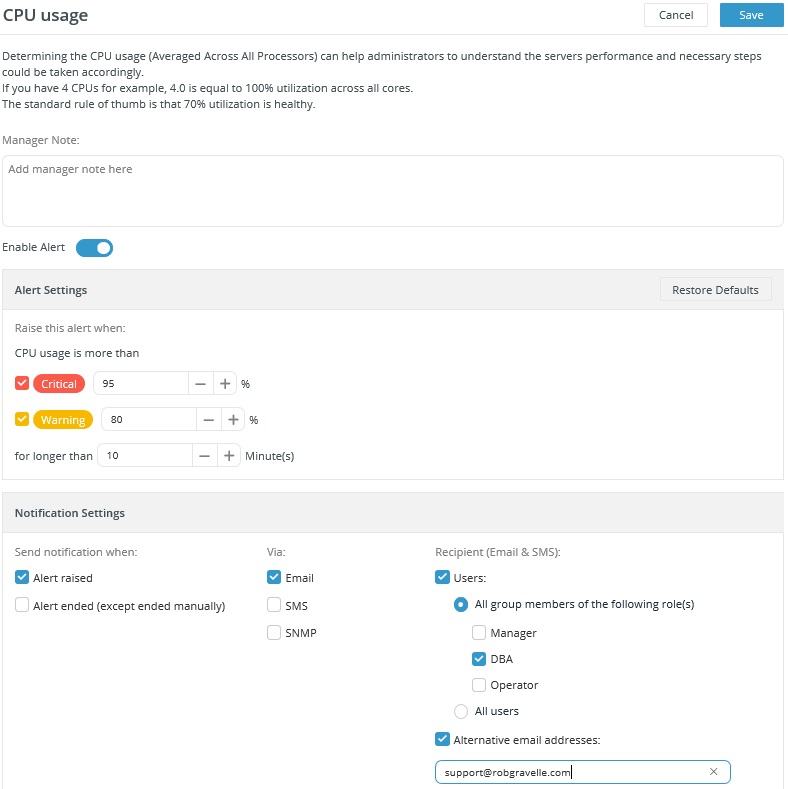
We can even send notifications to additional parties by including a comma delimited list of emails in the Alternative email addresses field.
Finally, click the Save button to update the Alert settings.
Setting Up Notifications
Navicat Monitor provides three options for sending notifications whenever an alert is raised in your monitored database instances or a system problem occurs while you are using them. The three options are: emails, SNMP traps and SMS messages. To configure the alert notifications, go to Configurations > Notifications.
Here are some example values to send email using a specific email address:
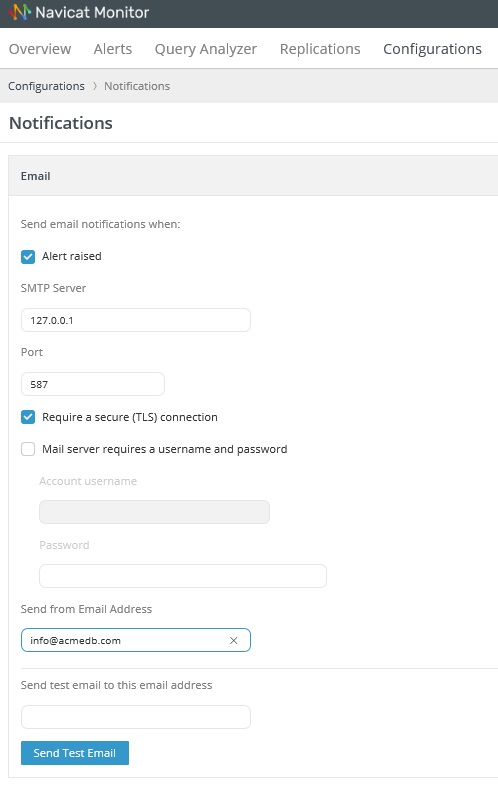
You're now all set up to receive email notifications!


