

The terms “monitoring” and “observability” are often used interchangeably in database and infrastructure conversations, but they describe two meaningfully different things. Getting clear on the distinction is not just an exercise in semantics; it shapes how you instrument your systems, what questions you can answer when something goes wrong, and ultimately how quickly you can resolve problems before they affect end users.
What Is Database Monitoring?
Monitoring is the practice of tracking a predefined set of metrics over time and alerting when those metrics cross certain thresholds. It answers the question: is something wrong? A monitoring system watches things like CPU utilization, memory usage, active connections, disk I/O, and query throughput. When any of these values breach a threshold you have configured - say, CPU consistently above 90% for five minutes - it fires an alert.
Monitoring is reactive by nature. You decide in advance what to measure, you set thresholds based on your expectations, and you wait to be notified when those expectations are not met. This works well for known failure modes: if your database has gone down before due to connection pool exhaustion, you monitor connection counts and alert before exhaustion happens again. Monitoring is essential, battle-tested, and well understood. Its limitation is that it only catches problems you have anticipated.
What Is Database Observability?
Observability is a broader concept borrowed from control theory and popularized in software engineering by the rise of distributed systems. Where monitoring tells you that something is wrong, observability helps you understand why. An observable system is one that has been designed to expose enough internal state - through metrics, logs, and traces - that you can reason about its behaviour even when the failure is entirely novel and unexpected.
The key distinction is that observability is proactive and exploratory. You are not just waiting for known thresholds to trip; you are building a system rich enough in data that you can ask arbitrary questions about what is happening inside it. For databases, this might mean being able to correlate a spike in query latency with a specific table lock, trace a slow query through its full execution plan, or compare the behaviour of one instance against historical baselines to identify subtle drift before it becomes an outage.
Observability does not replace monitoring, but rather, extends it. Think of monitoring as the alarm system and observability as the security camera network. The alarm tells you a door was opened; the cameras tell you who opened it, which way they went, and what they were carrying.
Why the Difference Matters in Practice
Modern database environments have grown significantly more complex. Teams manage multiple database engines, cloud-hosted instances, read replicas, and replication topologies, often simultaneously. In these environments, a simple threshold alert on CPU usage is rarely enough to diagnose a problem. The root cause might be a single long-running query, a poorly optimized join introduced in a recent deployment, or lock contention caused by an unusual traffic pattern. Tracing that chain of causation requires observability, not just monitoring.
The practical implication is that teams investing only in monitoring will find themselves reacting to alerts without the data needed to diagnose them quickly. Observability fills that gap by ensuring the evidence trail is already in place when something goes wrong.
Navicat Monitor: Bridging the Gap
Navicat Monitor 3 is a strong example of a tool that brings both monitoring and observability capabilities together in a single product, making it practical for teams that do not want to stitch together separate solutions.
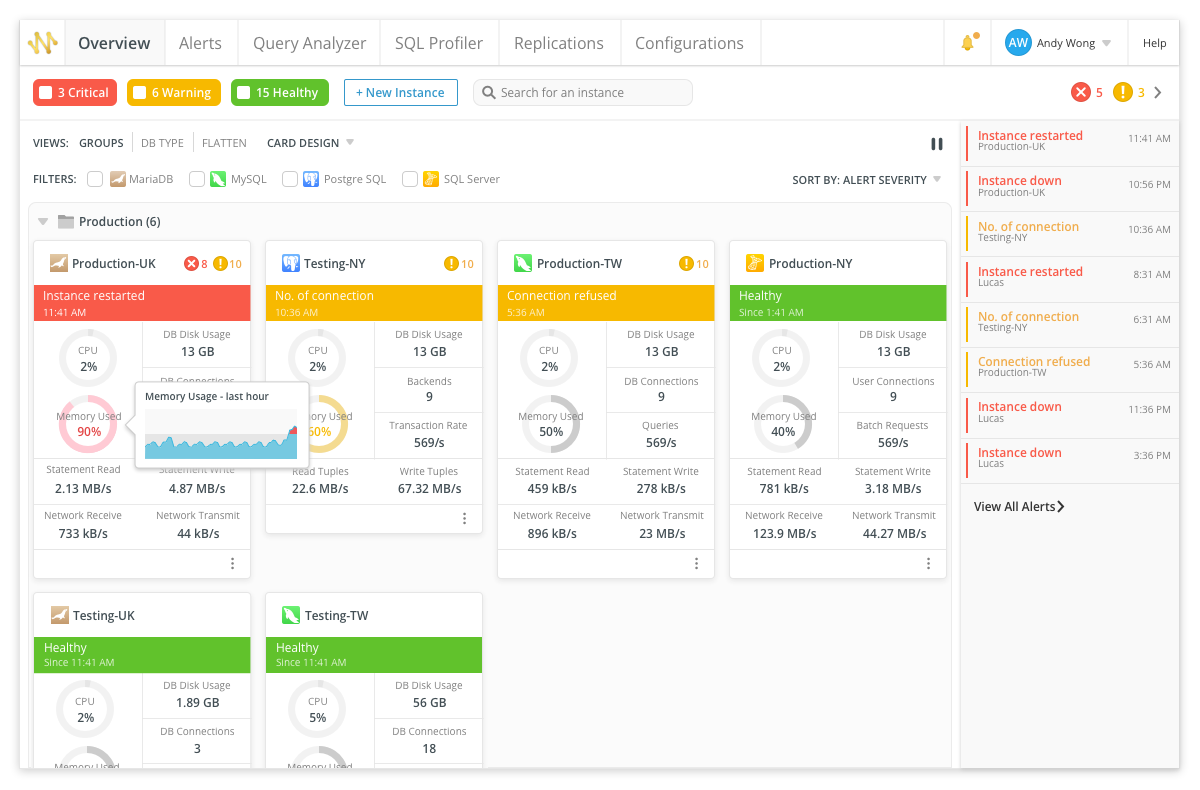
On the monitoring side, Navicat Monitor uses an agentless architecture, connecting to your database instances over SSH or SNMP without requiring any software to be installed on the servers themselves. It collects metrics at regular intervals - covering CPU load, RAM usage, disk utilization, network I/O, table locks, and more - and presents them as real-time and historical graphs. Crucially, it supports MySQL, MariaDB, PostgreSQL, and SQL Server, as well as cloud-hosted databases including Amazon RDS, Amazon Aurora, Google Cloud, Oracle Cloud, and Microsoft Azure. Custom alert thresholds can be configured for any metric, with notifications delivered via email, SMS, or SNMP, and server groups can be organized so that alert configurations are applied consistently across related instances.
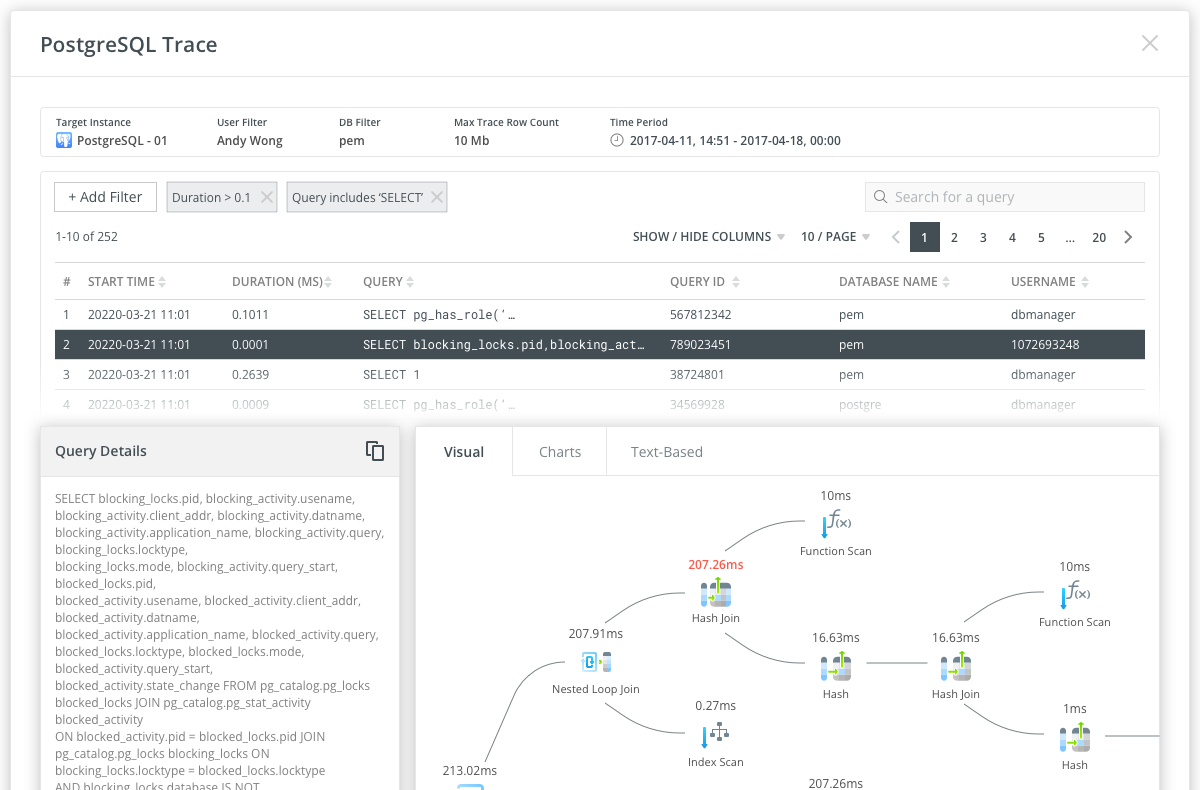
Where Navicat Monitor moves into observability territory is through its Query Analyzer and SQL Profiler. The Query Analyzer provides a graphical representation of query log data, making it possible to visualize query activity statistics, analyze individual SQL statements, and quickly surface long-running queries. Rather than simply alerting that query performance has degraded, it gives you the tools to understand which queries are responsible and why. The SQL Profiler, available for PostgreSQL instances, goes further still: it supports the creation of scheduled traces that collect query execution data based on filters you define, and execution plans for each traced query can be viewed in visual, chart, or text-based formats. This combination of perspectives is precisely what observability looks like in practice - the ability to drill into internal system behaviour at multiple levels of detail.
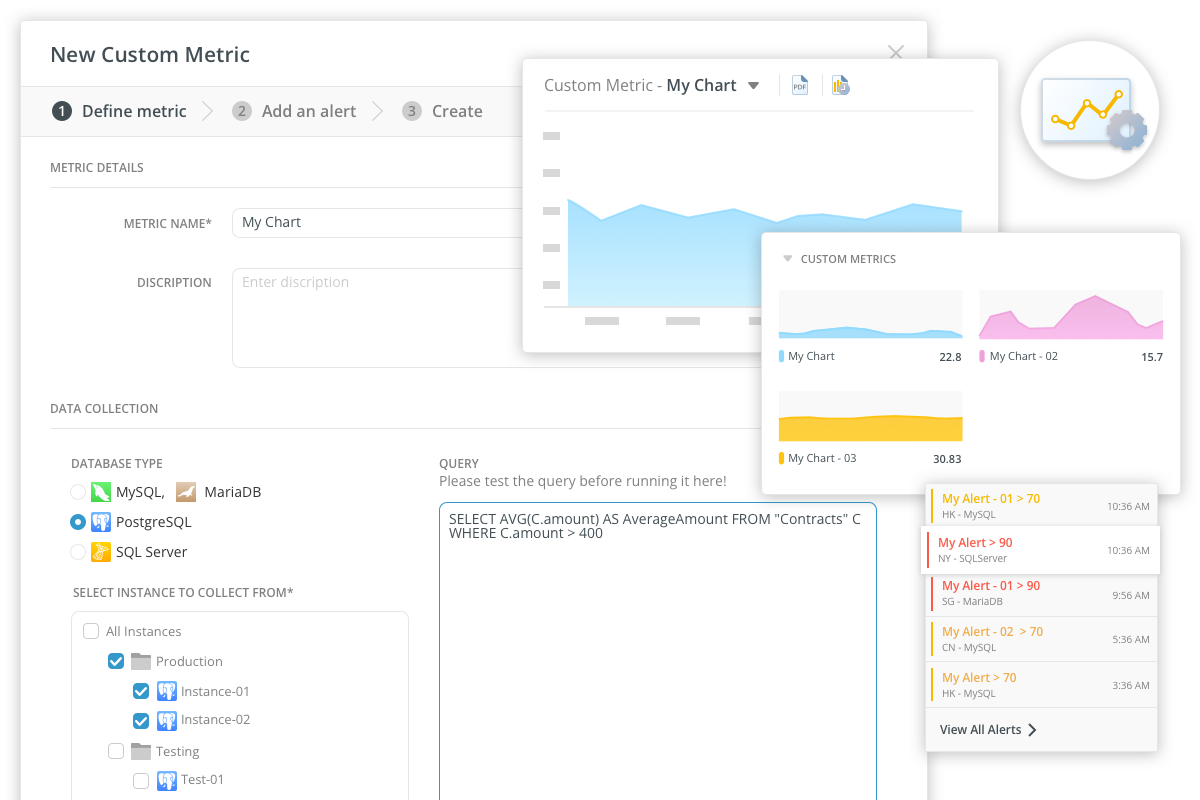
Navicat Monitor also supports custom metrics, allowing teams to write their own queries to collect performance data specific to their environment and set alerts on the results. This extensibility is an important observability characteristic: it means the tool can be shaped to expose whatever internal state matters most for your particular database workload, not just the generic signals that matter to everyone.
Conclusion
Monitoring tells you when something is wrong; observability gives you the context to understand why. Both are necessary, and the most effective database teams treat them as complementary rather than competing priorities. Tools like Navicat Monitor 3, which combine real-time alerting and threshold monitoring with deep query analysis and execution tracing, make it possible to close the gap between the two and to move from simply reacting to database problems to genuinely understanding and preventing them.


