

For years, many organizations have relied on simple uptime checks to gauge database health. While knowing your database is running is certainly important, uptime alone tells you almost nothing about performance, efficiency, or the user experience. A database can technically be "up" while delivering painfully slow queries, suffering from resource contention, or teetering on the edge of capacity exhaustion. Modern database monitoring requires a more sophisticated approach that focuses on metrics that actually impact your applications and users.
Query Performance Metrics
The most critical area to monitor is query performance, since queries are where your database directly interacts with your applications. Long-running queries are often the canary in the coal mine for deeper problems. By tracking query execution times, you can identify which specific queries are consuming excessive resources and causing bottlenecks. Equally important is understanding query wait times, which reveal what your queries are waiting for, whether that's disk access, locks, or network resources.
Beyond execution time, examining the top queries by CPU usage helps you identify which operations are most computationally expensive. Similarly, tracking queries by the number of reads and writes they perform can highlight inefficient data access patterns that might benefit from index optimization or query refactoring. These metrics transform abstract performance concerns into concrete, actionable insights.
Resource Utilization and Capacity
While CPU and memory usage might seem like basic metrics, understanding them in context is crucial. CPU utilization patterns tell you whether your database server has adequate processing power for your workload, but more importantly, sustained high CPU usage can indicate missing indexes or poorly optimized queries rather than simply insufficient hardware.
Memory metrics deserve particular attention because databases rely heavily on caching to achieve good performance. The buffer cache hit ratio, which measures the percentage of data requests served from memory rather than disk, should typically exceed 90 percent. When this ratio drops, it indicates that your database is frequently going to disk for data, dramatically slowing performance. Monitoring memory allocation over time also helps with capacity planning, showing you whether your database's memory footprint is growing at a sustainable rate.
Disk I/O metrics complete the resource picture. Tracking disk read and write operations per second, along with average disk response times, helps you understand whether storage is becoming a bottleneck. Network I/O is equally important for understanding how much data is flowing between your database and applications.
Connection and Session Activity
Monitoring active connections and session details provides visibility into how your applications are actually using the database. Tracking current user connections helps you understand your concurrent workload and can alert you to connection pool exhaustion before it causes application failures. Monitoring connection patterns over time also reveals usage trends that inform capacity planning decisions.
Lock monitoring is particularly critical for understanding contention issues. When queries are waiting for locks held by other sessions, users experience delays that simple CPU or memory metrics won't explain. By tracking both the locks currently held and sessions waiting for locks, you can identify problematic transaction patterns or long-running transactions that are blocking other work.
Measuring These Metrics with Navicat Monitor
Navicat Monitor provides an agentless architecture for monitoring MySQL, MariaDB, PostgreSQL, and SQL Server databases, which means you don't need to install software on your database servers themselves. The tool collects metrics at regular intervals and stores them in a repository database for historical analysis and trending.
For query performance monitoring, Navicat Monitor's Long Running Queries chart visualizes top queries based on execution duration, wait types, CPU usage, and read/write operations. This allows you to quickly identify problematic queries and drill down into their execution characteristics. The tool maintains historical data so you can track whether query performance is degrading over time.
Resource monitoring in Navicat Monitor covers the full spectrum of system metrics. It collects CPU load, RAM usage, and various other system resources over SSH or SNMP, giving you visibility into both database-level and operating system-level performance. The interactive dashboard provides real-time and historical graphs showing server load, disk usage, network I/O, and table locks, making it easy to correlate different metrics and identify patterns.
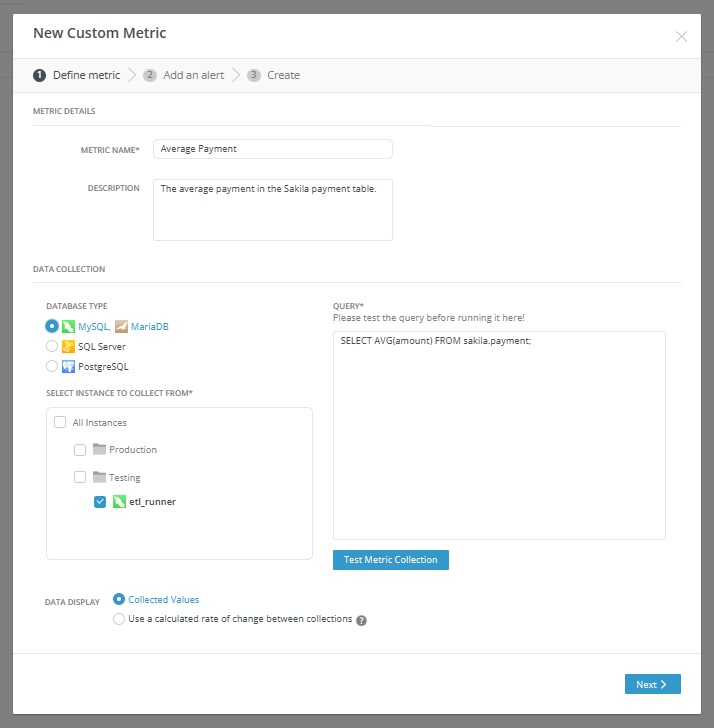
One particularly powerful feature is the custom metrics capability. You can write your own queries to collect performance metrics for specific instances and receive alerts when values exceed defined thresholds. This means you can monitor business-specific indicators or specialized performance characteristics that matter to your particular applications, going well beyond the standard preset metrics.
The alerting system in Navicat Monitor enables proactive management by notifying you when metrics cross configurable thresholds. You can set alerts for any metric, including custom ones, and define both the threshold value and how long it must be exceeded before triggering an alert. Notifications can be delivered via email, SMS, SNMP, or Slack, ensuring your team knows about problems before they impact users. The tool provides detailed alert analysis that includes metric charts, timelines, and historical context to help with root cause analysis.
Beyond the Dashboard: Making Metrics Actionable
Collecting metrics is only the first step. The real value comes from understanding patterns, setting appropriate baselines, and creating actionable alerts. Rather than simply watching dashboards, establish normal ranges for your key metrics based on historical data and workload patterns. This allows you to set intelligent alert thresholds that catch genuine problems without generating false alarms from normal variations.
Consider the relationships between metrics when investigating issues. A spike in disk I/O might correlate with a drop in buffer cache hit ratio and an increase in query execution times. Understanding these connections helps you identify root causes rather than just symptoms. Regular capacity planning reviews using historical trends ensure you can scale proactively before hitting resource constraints.
Moving from simple uptime monitoring to comprehensive performance monitoring will significantly impact how you understand and manage your databases. By focusing on metrics that directly impact application performance and user experience, you can move from reactive fire-fighting to proactive optimization, ensuring your databases deliver consistent, reliable performance.


