

It seems like only yesterday that Navicat Monitor 2.0 was released, adding great new features to an already stellar product. Now, version 3.0 is introducing yet more outstanding features, including:
- Support monitoring PostgreSQL instances.
- Support SQL Profiler for PostgreSQL instances.
- Enhanced Query Analyzer.
- Enhanced Long Running Queries.
- Many other new features and improvements.
Of course, all of Navicat Monitor's existing functionality remains in place, including:
- Agentless Architecture
- Real-time Performance Monitoring
- See how your instances are currently functioning easily
- Advanced root cause analysis
- Set custom alert thresholds
- Get notifications via email, SMS or SNMP
- Replication Monitoring
- Powerful Query Analyzer
- and more...
In today's blog, we'll be taking a look at the brand new Navicat Monitor 3.0 with the emphasis being on the new features listed above.
About Navicat Monitor
Navicat Monitor is a safe, simple and agentless remote server monitoring tool that includes many powerful features to make your monitoring effective as possible. You can access Navicat from anywhere via a web browser to access statistics on server load and performance regarding its availability, disk usage, network I/O, table locks and more. Using this valuable data, you can easily examine possible solutions, tune the databases, and address potential issues before they can become serious problems or costly outages.
Navicat Monitor is a server-based software which can be accessed from anywhere via a web browser. With web access, you can easily and seamlessly keep track of your servers around the world, around the clock.
Support for PostgreSQL Instances
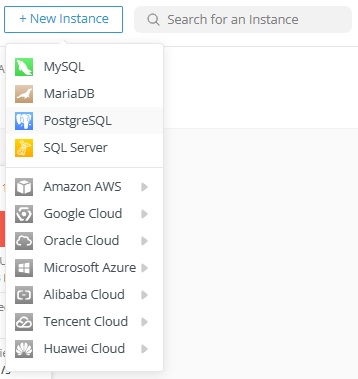
Just as version 2 added support for SQL Server, version 3 can monitor PostgreSQL as well. Here are all supported DB types in the New Instance menu:
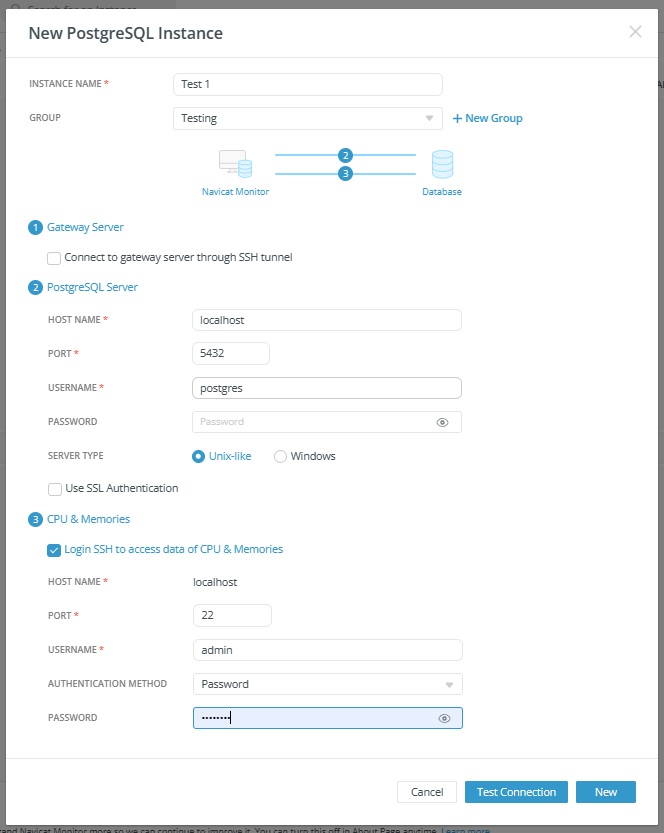
Selecting PostgreSQL from the list brings up the New PostgreSQL Instance dialog, which includes all of the configuration options that you might need for a PostgreSQL instance:
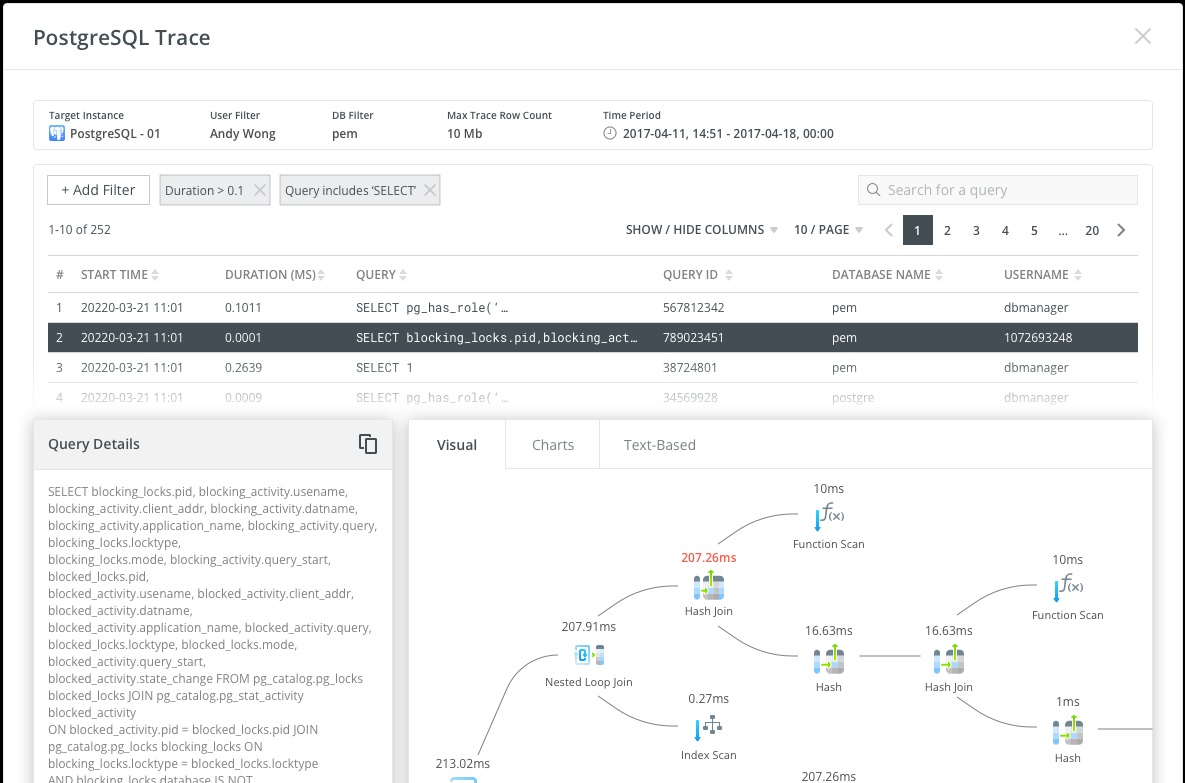
You'll be happy to know that the SQL Profiler also works for PostgreSQL instances. It's a tool that provides graphical query execution details for locating inefficient and slow queries. It supports the creation of traces to collect data about the queries executed on an instance. The data can later be analyzed and used to troubleshoot performance issues.
Enhanced Query Analyzer and Long Running Queries
The Query Analyzer tool provides a graphical representation of the query logs that makes interpreting their contents much easier. In addition, the Query Analyzer tool enables you to monitor and optimize query performance, visualize query activity statistics, analyze SQL statements, as well as quickly identify and resolve long running queries. In version 3, the Long Running Queries chart has been moved to the top of the page for easier identification:
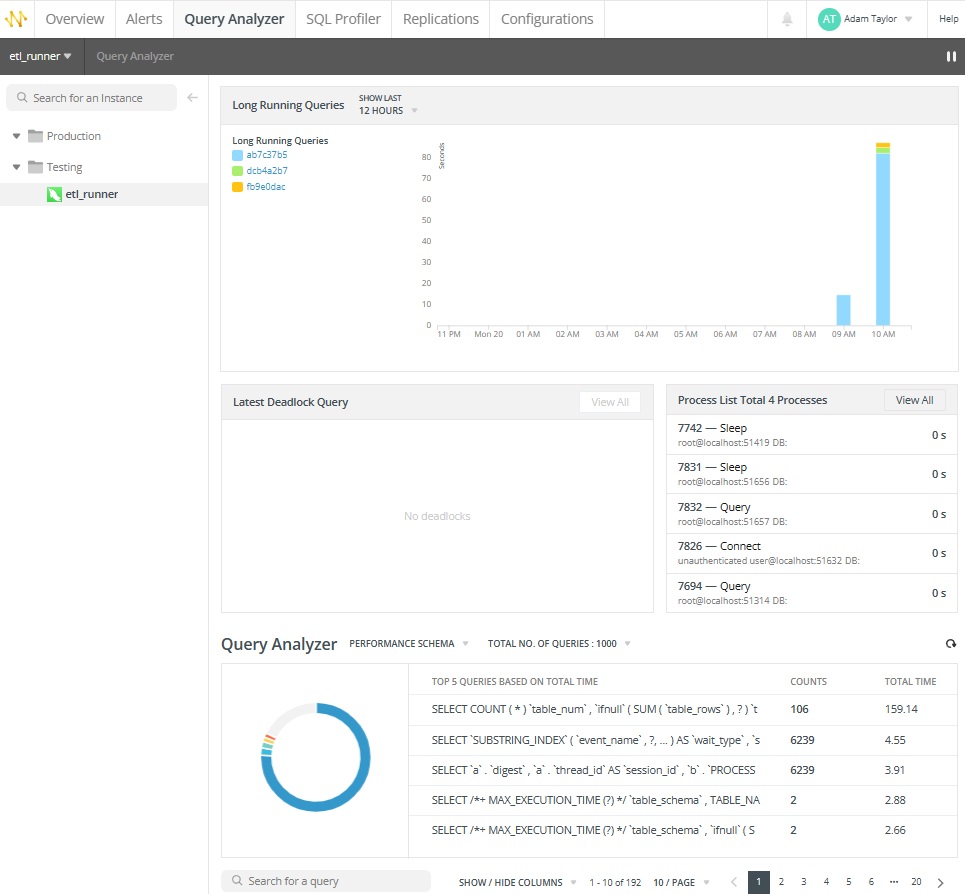
Moreover, the entire Long Running Queries section provides the ability to drill down to specific intervals:
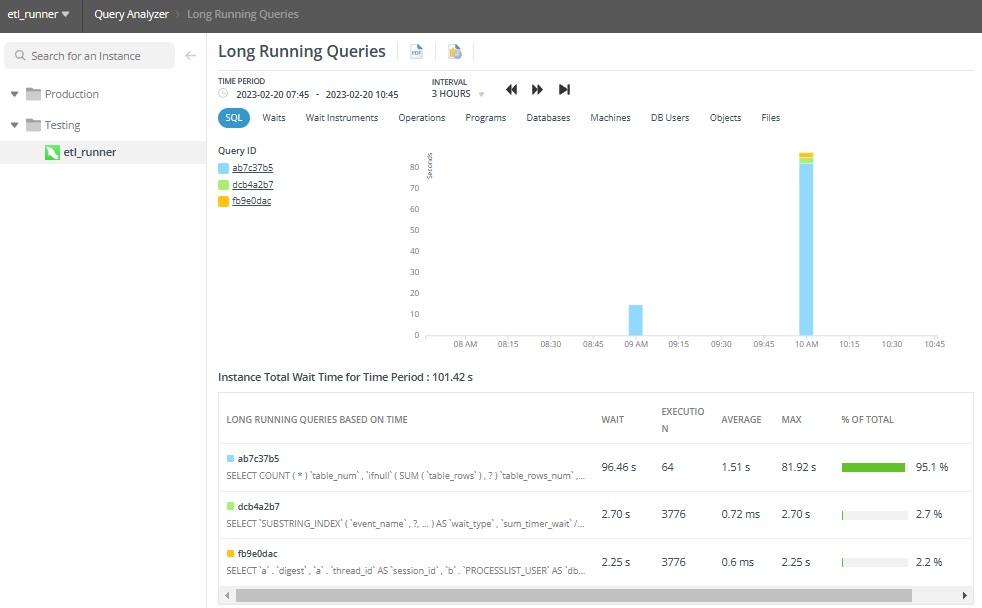
Information about Long Running Queries may be exported as a PDF or scheduled report.
Final Thoughts on Navicat Monitor 3.0
In this blog, we explored just a few of the exciting new features of Navicat Monitor 3.0, including Support for PostgreSQL Instances, as well as Enhanced Query Analyzer and Long Running Queries. There are plenty more new features that we'll be looking at over the next several weeks.
Navicat Monitor 3.0 is available for Windows, macOS (using Homebrew), and Linux. You can try Navicat Monitor 3.0 for 14 days free of charge to sample of all its new features before you buy.


