SQLite is a lightweight, self-contained, and serverless relational database management system (RDBMS) that is widely used for embedded systems, mobile applications, and small to medium-sized websites. It is easy to set up, requires minimal configuration, and offers a powerful set of features for managing and manipulating data. In this guide, we will walk you through the process of getting started with SQLite, including installation and using the popular Chinook sample database for SQL examples.
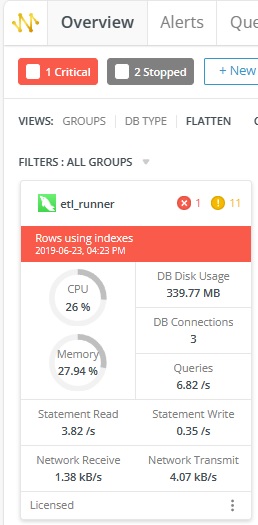
Navicat Monitor 3 is a safe, simple and agentless remote server monitoring tool that includes many powerful features to make your monitoring effective as possible. You can access Navicat Monitor from anywhere via a web browser to access statistics on server load and performance regarding its availability, disk usage, network I/O, table locks and more.

Did you know that you can also collect custom performance metrics for specific instances using your own query, and receive alerts about your custom data when the metric value passes certain thresholds and durations? Custom metrics can even be displayed as charts to help better understand your data and quickly identify trends. In today's blog we'll create a custom metric that shows the average cost of movie rentals in the Sakila Sample Database.
In the digital age, databases play a vital role in managing and organizing information for countless applications and systems. As stewards of valuable data, it's essential for businesses and developers to be mindful of the types of information stored in their databases. While databases are designed to efficiently handle data, there are certain types of information that should almost never be stored in a database. In this article, we'll explore three things you should avoid storing in your database to maintain data integrity, security, and compliance.
In today's digital age, data is the lifeblood of organizations. As such, securing that data has never been more crucial. To safeguard sensitive data from unauthorized access, breaches, and other security threats, it's essential to implement robust security measures. This article will offer a few such measures for securing your relational databases.
MySQL, one of the most popular relational database management systems, offers a variety of storage engines, each designed to cater to specific needs and use cases. When it comes to optimizing your database performance and ensuring data integrity, selecting the right storage engine is crucial. In today's blog, we'll explore the key factors to consider when choosing a storage engine for your MySQL tables.
- 2026 (1)
- February (1)
- January (1)
- Harnessing PostgreSQL Power: An Introduction to Supabase
- The ROI of Database Automation: Quantifying the Business Value of Automated Tuning, Patching, and Optimization
- Database Observability: The New Frontier in Performance Management
- The Database Skills Gap Crisis: Navigating the Shortage of Database Professionals
- The Economics of Multi-Cloud Databases
- 2025 (1)
- December (1)
- November (1)
- October (1)
- September (1)
- August (1)
- Going Beyond Basic Monitoring with Modern Database Observability Platforms
- Privacy-Preserving Databases: Protecting Data While Enabling Access
- Privacy-Preserving Databases: Protecting Data While Enabling Access
- Privacy-Preserving Databases: Protecting Data While Enabling Access
- A Guide to Database Sharding as a Service
- July (1)
- June (1)
- The Rise of Embedded AI/ML Capabilities in Modern Databases
- Immutable Databases: the Evolution of Data Integrity?
- Seamless Information Access Through Data Virtualization and Federation
- Database DevOps Integration: Bridging the Gap Between Development and Operations
- Navicat Sponsors SQLBits 2025 – Supporting the Future of Data Platforms
- May (1)
- Edge Databases: Empowering Distributed Computing Environments
- The Rise of Low-Code/No-Code Database Interfaces: Democratizing Data Management
- Data Vault 2.0: A Modern Approach to Enterprise Data Modeling
- Streaming-First Architectures: Revolutionizing Real-Time Data Processing
- Navicat Proudly Sponsors PGConf.de 2025 as Silver Sponsor (Two Free Tickets Up for Grabs!)
- April (1)
- March (1)
- February (1)
- January (1)
- 2024 (1)
- 2023 (1)
- 2022 (1)
- 2021 (1)
- 2020 (1)
- 2019 (1)
- 2018 (1)
- 2017 (1)


