

Version 3 of Navicat Monitor has just be released. Unsurprisingly, it packs many outstanding new features, as well as numerous improvements to existing features. One of the most noteworthy changes between version 2 and 3 is added support for PostgreSQL, including an SQL Profiler for PostgreSQL instances.
Today's blog will provide a quick guide on getting setup to monitor your be PostgreSQL instances using Navicat Monitor 3.0.
Adding a PostgreSQL Instance
You can see all of the monitored database instances on the Overview screen. In order to monitor our PostgreSQL instance, we need to add it to this screen. To do that, we simply need to click the "+New Instance" button at the top of the screen. Doing so presents a context list of available database types - both traditional and cloud-based:
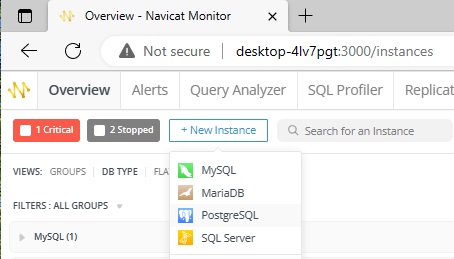
Select the PostgreSQL item to open the New PostgreSQL Instance dialog:
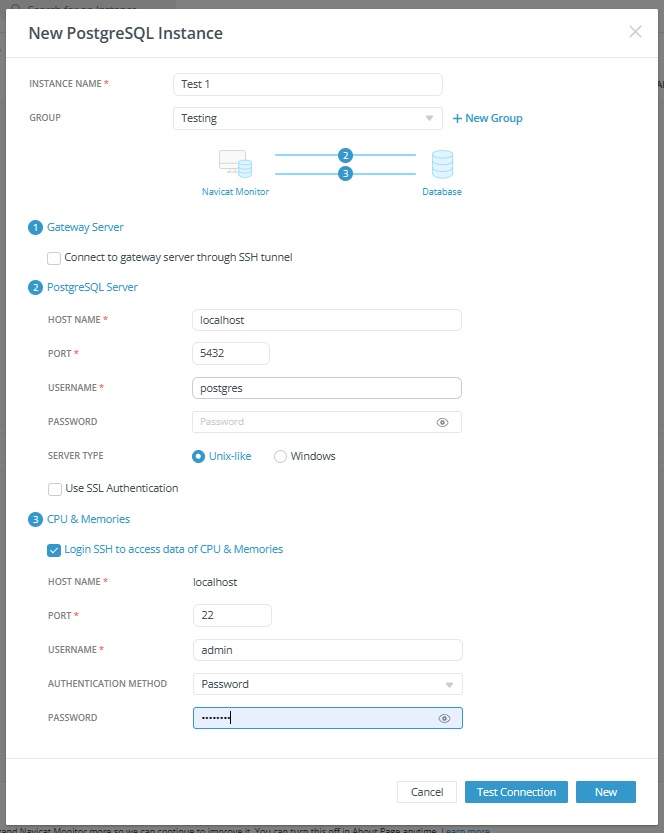
Navicat Monitor can connect the database server over a secure SSH tunnel to send and receive monitoring data. It allows you to connect your servers even if remote connections are disabled or are blocked by firewalls.
In the PostgreSQL Server section, enter the following information:
- Host Name: The host name or IP address of the database server.
- Port: The TCP/IP port for connecting to the database server.
- Username: A monitoring user for connecting to the database server.
- Password: The login password of the monitoring user.
- Server Type: The type of the server. Can be Unix-like or Windows.
Navicat Monitor can also collect the DB server's system performance metrics such as CPU and memory resources. If you do not provide this login, you can still monitor your server, but system performance metrics will not be shown.
Once you've entered all of the above information, click the "New" button to create the new instance.
Activating a Token
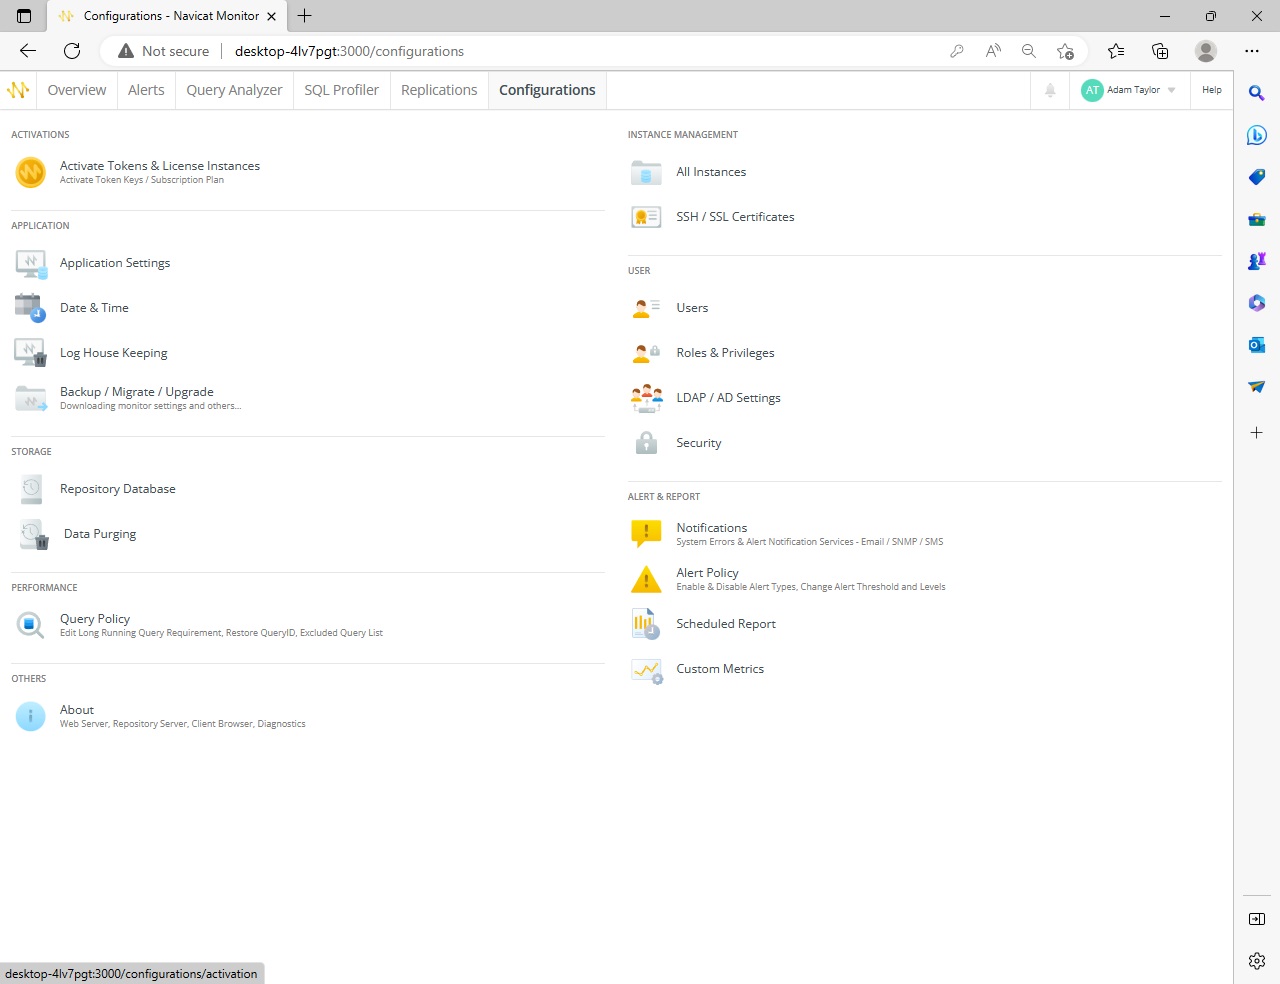
Now that we've added our PostgreSQL instance, we're ready to activate it. To do that, we'll need to assign a token to it via Configurations > Activate Tolens & License Instances.
To activate the instance, we can locate it in the Unlicensed Instances list, check the box beside it, and click the License button to move it into the Licensed Instances list. Here's our "PostgreSQL Test DB 1" instance in the Licensed list:
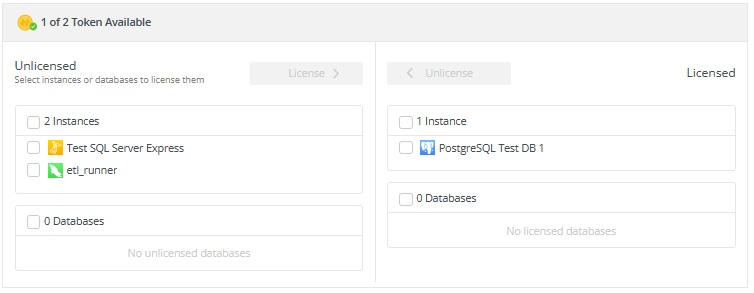
We can now receive server statistic details about our instance's performance regarding query execution as well as server load, availability, disk usage, network I/O, table locks and more. By easily tracking the deviations and traffic among servers, we can examine possible solutions and adjust our server settings accordingly.
Monitoring Query Performance
The Query Analyzer tool provides a graphical representation of the query logs that makes interpreting their contents much easier. In addition, the Query Analyzer tool enables us to monitor and optimize query performance, visualize query activity statistics, analyze SQL statements, as well as quickly identify and resolve long running queries. Here's the Query Analyzer for our new instance:
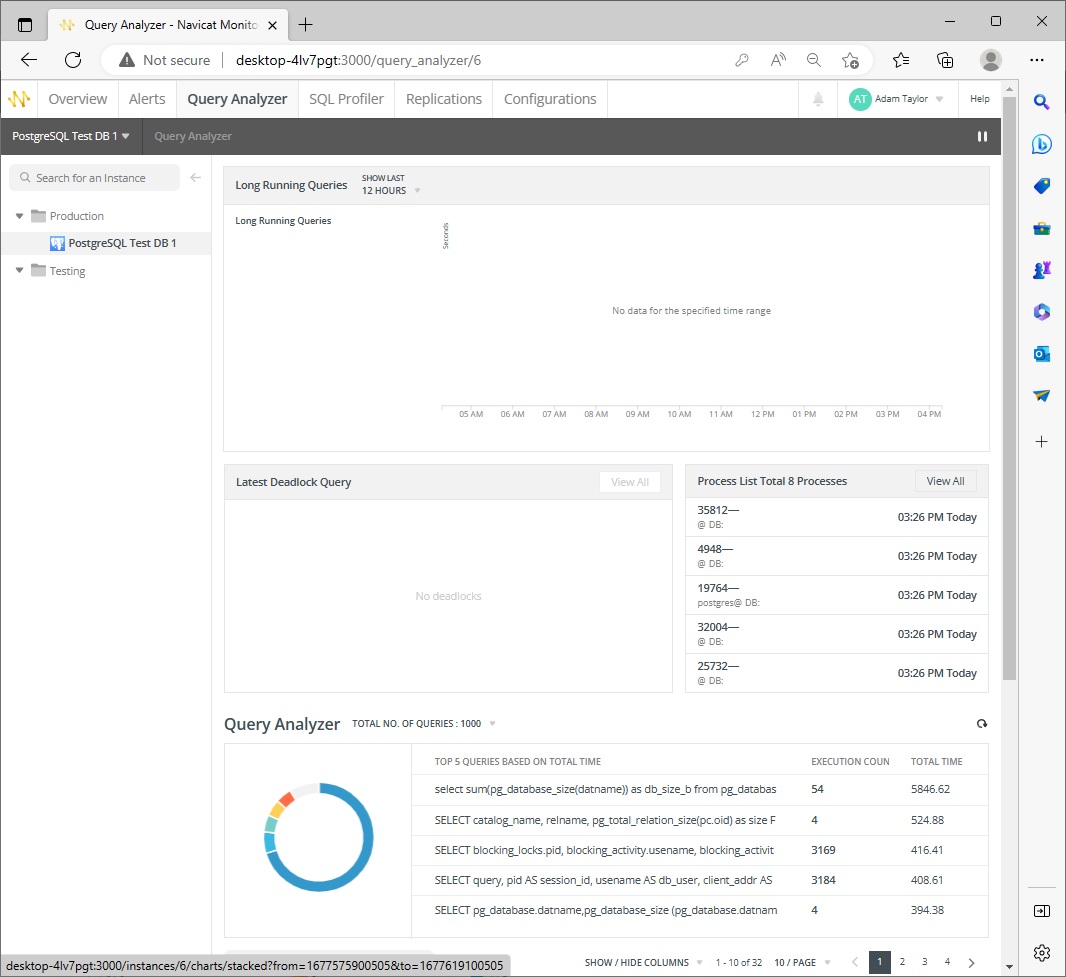
There are no Long Running Queries at this time because the database is new and not currently in use.
Final Thoughts on Monitoring PostgreSQL with Navicat Monitor 3.0
Thanks to Navicat Monitor 3.0, we can now monitor our PostgreSQL instances, via many useful tools, including the Enhanced Query Analyzer and Long Running Queries screens.
Navicat Monitor 3.0 is available fore Windows, macOS (using Homebrew), and Linux. You can try Navicat Monitor 3.0 for 14 days free of charge to sample of all its new features before you buy.


