Query Results
You can execute your queries across any server. Simply select the target connection, database, and/or schema from the drop-down list on the toolbar, and then click  Run.
Run.
If the statement is correct and is supposed to return data, the Result tab will open displaying the returned data in a grid. If an error occurs, execution stops and an appropriate error message is displayed.
Hint: For Snowflake servers, you can change the system-defined role used to execute queries using drop-down menu.
Execution Options
You are not limited to running the entire query at once. You can execute specific portions of your code:
Run Selected - Highlight the specific code in the editor and click
Run Selected.Run Current Statement - Position your cursor within the desired statement, click the down arrow next to the
Run button, and select Run Current Statement.
Hint: You can select Continue on error from the Run button to ignore errors during query execution.
Result Tab Toolbar
The toolbar provides the following functions:
Button |
Description |
MySQL, Oracle, PostgreSQL, SQLite, SQL Server, MariaDB, Snowflake |
|
|
Activate the cell editors for viewing and editing data. |
|
Profile the data in the query. |
|
Export the result of the query. |
MongoDB |
|
|
Activate the cell editors for viewing and editing data. |
|
[Grid View] Use the specified type color set on the Type Color pane to highlight cells. |
|
Export the result of the query. |
Redis |
|
|
Activate the editor for viewing and editing data. |
Common |
|
|
Pin the tab. |
 Cell Editor
 Data Profiling
 Export
 Type Color
Note: Navicat supports returning up to 20 concurrent result sets. For MongoDB, Navicat only returns the last result data.
Query Parameters
Note: Available only for MySQL, Oracle, PostgreSQL, SQLite, SQL Server, MariaDB and Snowflake.
Navicat supports the use of parameters inside the query text, allowing you to dynamically add variable values each time you run a query. The parameter should appear as an identifier with $ at its beginning, quote with [ ], e.g. [$any_name].
When you execute the query, an Input Parameter dialog will prompt you to enter the desired data. You can check the Raw Mode option to pass the inputted values directly to the query without quotation marks.
Adjust Result Position
In Navicat, you have the flexibility to configure how query results are displayed. You can choose to show the query results on an entire page, on the right side of the editor, or at the bottom of the editor. This allows you to adapt the display layout based on your specific needs and preferences during data analysis and exploration in Navicat. To change the result position, use the  or
or  icon located in the upper right corner, or access the View -> Result menu.
Pin Query Result (Available only in Enterprise and Standard Edition)
Existing result tabs are removed when you re-execute the query. You can pin a result tab so that it remains visible after re-executing the query. Simply click  Pin and its contents will not be cleared the next time you execute it.
When you pin a tab, it will display a pin icon and automatically moves towards the left side of the tab bar. All pinned tabs appear from left to right in the order you pinned. Hover over a pinned tab will show its execution time and the query. You can pin any number of results and quickly see what's pinned and what's not pinned. Simply click  Unpin to unpin a tab.
Custom Tab Name
Note: Available only for MySQL, Oracle, PostgreSQL, SQLite, SQL Server, MariaDB, Redis and Snowflake.
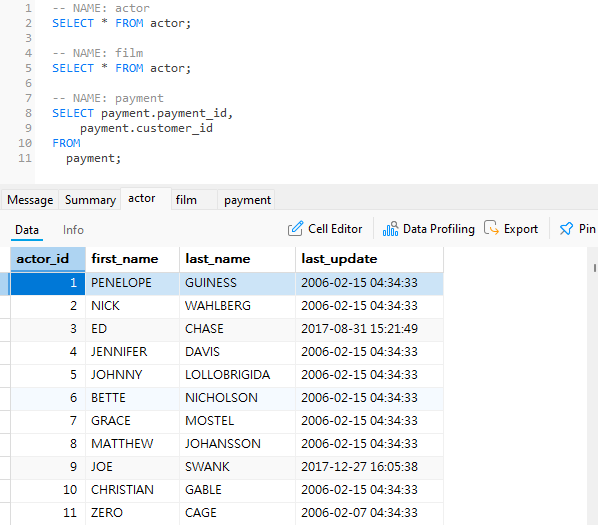
To customize the names of the result tabs, simply add -- NAME:tab_name or /*NAME:tab_name*/, or // NAME:tab_name (for Redis) before each statement in the editor.
Show Query Profiling and Status
Note: Available only for MySQL and MariaDB.
To show the query profiling and status when running the query, simply choose View -> Show Query Profiling and Status and click Run on the toolbar.
The Query Profiling tab under the Result tab displays the query profiling: Table lock, System lock, Statistic, etc.
Note: For MySQL 5.0, supported from 5.0.37. For MySQL 5.1, supported from 5.1.24.
The Status tab displays the query status: Bytes received, Bytes sent, etc.