Create Diagram
A diagram is a visual representation of the relationships and structure of a data model. It depicts the tables, fields, collections, entities, attributes, and relationships between them in a clear and concise manner. You can use it in database design and development processes to communicate and document the logical organization of data within your system.
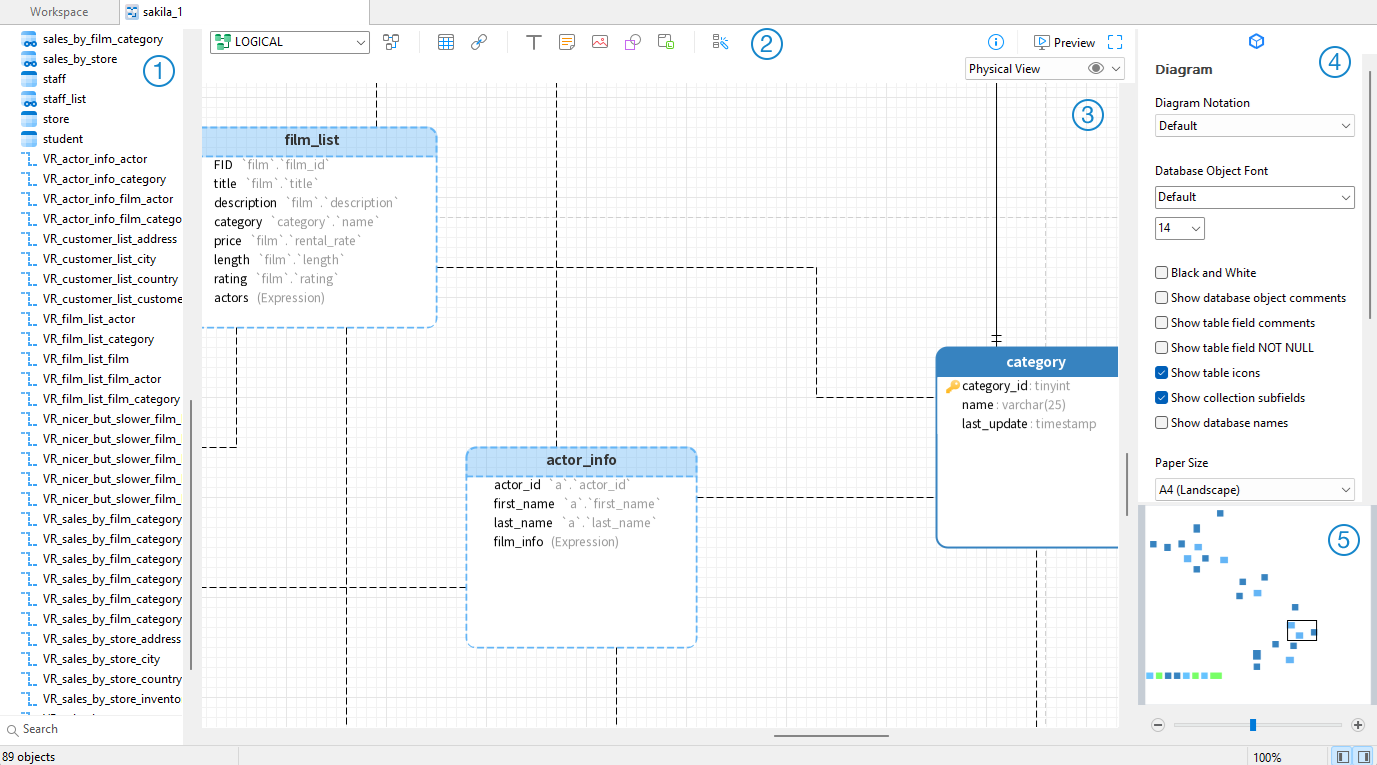
 Object Pane
The Object pane displays a list of all objects used in the diagram.
 Toolbar
The Toolbar is located near the top of the diagram. The buttons display in the toolbar depend on the model type and server type. You can use the toolbar to perform some basic tasks, such as adding tables, views, functions, collections or entities, applying Auto Layout feature, etc.
 Canvas
You can design your diagram on the Diagram Canvas. All added objects can be moved (by dragging them with mouse or by keyboard), resized, aligned to the grid, etc.
 Properties Pane
The  Properties tab includes the basic layout settings, object settings and so on. The properties vary with the type of the object selected.
The  DDL tab shows the DDL of the selected object.
 Overview Pane
The Overview pane displays the whole active diagram in the canvas. To zoom in or zoom out the selected area of the diagram, adjust the slider. Same effect can be achieved with keyboard shortcuts:
Zoom In: [CTRL++] or [CTRL+Mousewheel Up]
Zoom out: [CTRL+-] or [CTRL+Mousewheel Down]
Create New Diagram
The essential steps to create a diagram are:
In the Workspace window, click
 New Diagram.
Enter the name of the diagram.
Click OK.
A tab will open for you to edit the diagram.
Properties
Once you have selected the diagram canvas, you can customize the diagram by changing its properties:
Option |
Description |
Default Model |
Choose the default model of the diagram. All objects created in the diagram belong to the default model. |
Diagram Notation |
Choose the notation framework used to illustrate relationships (e.g., Crow's Foot, IDEF1X, or UML). |
Database Object Font |
Set the font style of the database objects. |
Black and white |
Change the diagram color scheme to black and white. |
Show database object comments |
Show object-level comments on the object blocks. |
Show table field comments |
Show field or column-level comments within the tables in the diagram. |
Show table field NOT NULL |
Show "NOT NULL" on the diagram if a field is restrict null values. |
Show table icons |
Display corresponding graphic icons next to table headers for dimensional and data vault models. |
Show collection subfields |
Show nested document fields inside MongoDB collections. |
Show database names |
Show the database names before the object names in the diagram (e.g., db.table1). |
Paper Size |
Set the paper size dimensions of the canvas. |
Pages |
Set the total width and height of the canvas grid, measured in consecutive page segments. |