Main UI
The main window is a comprehensive workspace designed for efficiency. It consists of several integrated toolbars and panes that allow you to manage connections, database objects, and advanced utilities from a single interface.
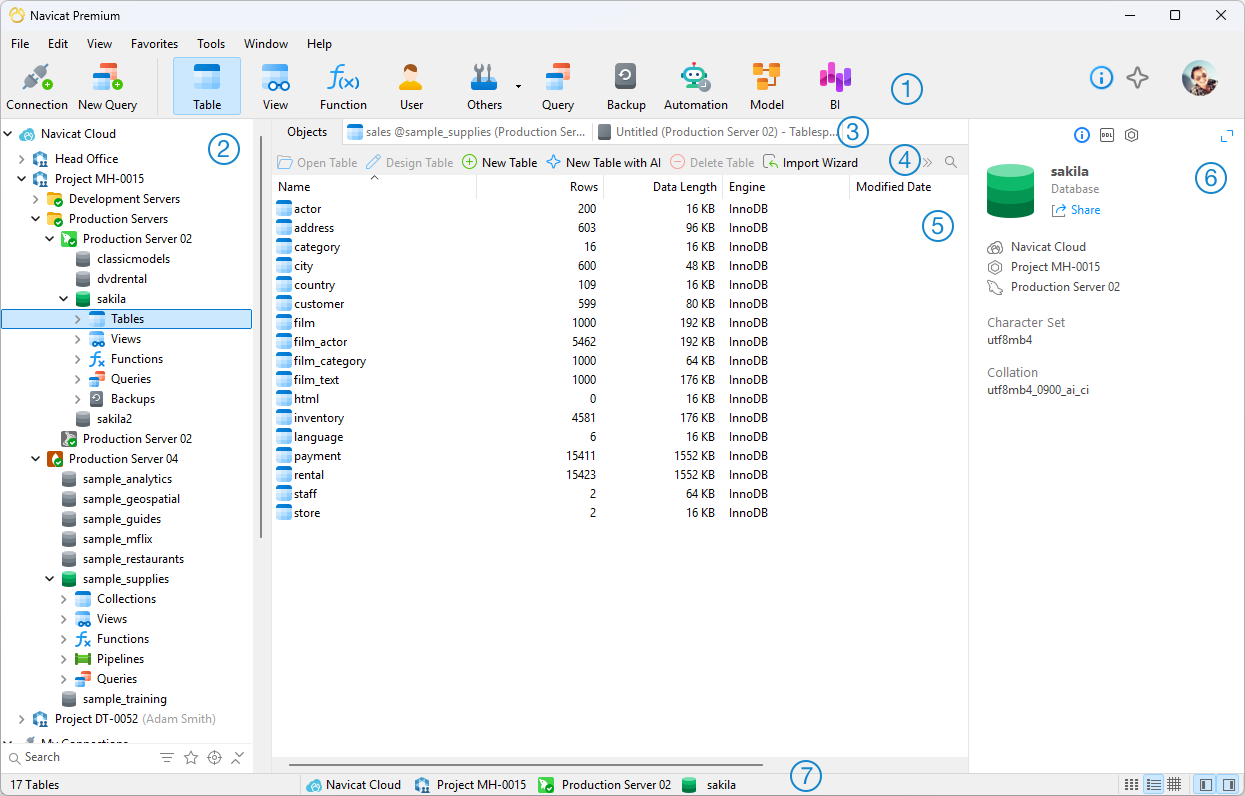
Main Window Components
 Main Toolbar
The Main Toolbar allows you to access basic objects and features, such as connections, users, tables, collections, backup, automation and more. To use small icons or hide the captions, right-click on the toolbar and disable Use Big Icons or Show Caption.
 Navigation Pane
The Navigation Pane is the basic way to navigate with connections, databases and database objects. If the pane is hidden, choose View -> Navigation Pane -> Show Navigation Pane.
 Tab Bar
The Tab Bar allows you to switch among the tabbed windows on the Object Pane. You can choose to always display pop-ups on a new tab, or to always display them in a new window. If you have multiple tabs open, you can use CTRL+TAB to easily switch to other tabs. See also Options.
 Object Toolbar
The Object Toolbar provides other controls that you can use to manipulate the objects.
 Object Pane
The Object Pane displays a list of objects (such as tables, collections, views, queries) and the tabbed window forms. Use the  List,
List,  Detail and
  ER Diagram buttons to change the view of the Objects tab.
 Information & AI Chat Pane
This shared pane provides a versatile area for both database auditing and intelligent development. Use the top buttons to switch between the Information Pane (comprehensive metadata, object dependencies, DDL, etc.) and the AI Chat Pane (intelligent SQL generation and optimization via natural language). If the pane is hidden, choose View -> Information Pane -> Show Information Pane.
 Status Bar
The Status Bar provides real-time updates on active processes, connection states, and specific window information.
Navigation Pane
The Navigation pane employs tree structure which allows you to take action upon the database and their objects through their pop-up menus quickly and easily. If the Show objects under schema in navigation pane option is checked at the Options window, all database objects are also displayed in the pane. To connect to a database or schema, simply double-click it in the pane.
After logged in Navicat Cloud or On-Prem Server, you can find it in the Navigation pane, and all connections stored locally will be located under the My Connections section.
Table elements, such as fields, indexes and foreign keys, are display under each table. Click the arrow to the left of the table name to expand the list. If the elements are hidden, enable the Show objects under table in navigation pane option in the Options window.
You can simply rename a field by using the pop-up menu, or you can double-click an element to open the table designer.
If you want to hide the group structure in the Navigation pane, choose View -> Navigation Pane -> Flatten Connection.
If the Navigation pane is hidden, choose View -> Navigation Pane -> Show Navigation Pane.
Filter Navigation Pane
You can use the Filter bar at the bottom of the Navigation pane to quickly isolate, search, and manage your connections and database objects.
If you prefer the Filter bar at the top of the Navigation pane, choose View -> Navigation Pane -> Show Filter On Top.
Option / Button |
Description |
Search box |
Enter a search string to instantly filter and display only the objects, groups, or connections that contain that string. Matching categories will automatically expand to show their filtered results. |
|
Click to filter your view by specific connection types, database vendors, or active database objects. |
|
Toggle to isolate and display only your starred connections. |
|
Instantly locate and highlight the database object of your currently active tab within the Navigation pane. |
|
Collapse all expanded connections, schemas, objects, and groups back into their top-level. |


Object Pane
In the Objects tab, you can use the List, Detail and ER Diagram buttons to change the object view.
If you want to hide the group structure in List view or Details view, choose View -> Flatten Object List.
List View
By default, Navicat uses the List view. It only shows the names of objects.
Detail View
Detail view shows the name and several properties of objects in columns. To change the display columns of properties, choose View -> Choose Columns and choose display columns for different objects from the pop-up window.
ER Diagram View (Available only in Enterprise and Standard Edition)
Note: Available only for MySQL, Oracle, PostgreSQL, SQLite, SQL Server, MariaDB and Snowflake. Only tables provide ER Diagram view.
An ER diagram will be generated automatically if the selected database/schema contains tables. ER diagram files are stored under Settings Location.
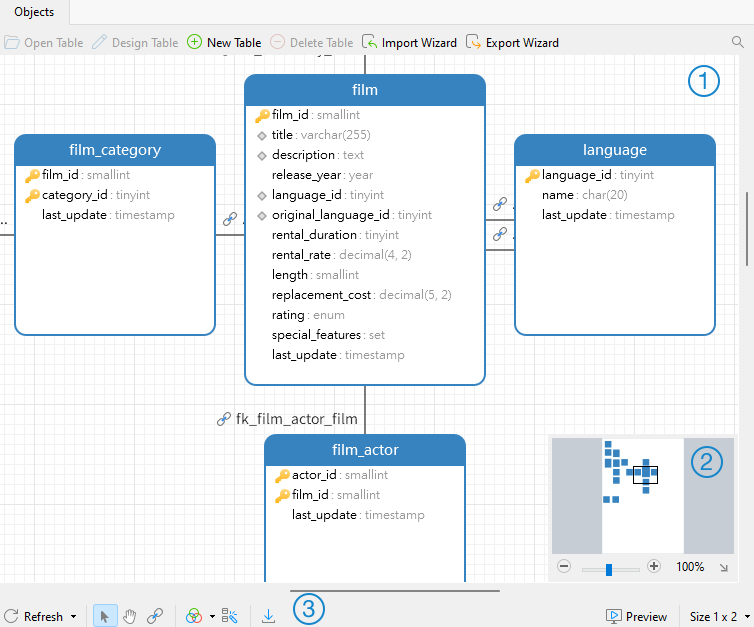
Diagram Canvas
Graphically display table fields and the relationships between tables in a database or schema.
Action |
Description |
Add a Foreign Key |
Click |
Edit or Delete a Foreign Key |
Right-click a relation line and select Design Foreign Key or Delete Foreign Key. |
Quick Access |
Double-click a table in the ER Diagram view will open the Table Designer, while double-click a table in the List or Detail view will open the Table Viewer. |
 from the bottom toolbar. Drag and drop a field from the child table to the parent table.
 Overview
Adjust the slider in the Overview pane to zoom in or out of the selected diagram area. You can also use the following keyboard shortcuts:
Zoom In: CTRL++ or CTRL+Mousewheel up
Zoom Out: CTRL+- or CTRL+Mousewheel down
Bottom Toolbar
Button |
Description |
|
Refresh - Refresh the ER diagram. |
|
Switch the cursor to the Select mode. |
|
Switch the cursor to the hand mode for moving the diagram. Or, you can press and hold the SPACE key, then move the diagram. |
|
Add a relation between two table fields. Click this button, and then drag and drop a field from the child table to the parent table. |
|
Set the color of the selected tables or relations. |
|
Automatically arrange all tables or just the selected tables on the canvas. |
|
Export the ER diagram to a PNG file. |
|
Preview the diagram in fullscreen mode. |
Size |
Select a paper size from the drop-down list. The corresponding paper size will reflect in the Overview pane. |
 Refresh


 Preview
Information Pane
The Information Pane displays comprehensive metadata, including detailed object information, project activities, the DDL of database objects, object dependencies, and user/role memberships. It also provides a read-only preview of query statements. If the pane is hidden, choose View -> Information Pane -> Show Information Pane.
You can select any connections, objects or projects, and then select the corresponding buttons on the Information Pane.
Button |
Description |
|
General - Show the general information of the object/project. |
|
Preview - Show the SQL statements in the query. |
|
DDL - Show the DDL statements of the object. Press CTRL+F to open the search box. |
|
Using - Show the objects that the selected object depends on. |
|
Used By - Show the objects that depend on the selected object. |
|
Code Snippet - Show all built-in and custom code snippets. |
|
Identifiers - Show all available tables, collections, views or fields in the selected database or schema. |
|
Privileges - Show the privileges granted to the user. |
|
Project - Show the project members and the project activities done by the members. Click + to add members to the project. |
|
Type Color - Set the color of particular types for highlighting cells in Grid View. |
|
Pub/Sub Info - Show which channels are active on the Redis server. |


Expand and Collapse Pane
The Information Pane's width can be quickly adjusted for optimal viewing, providing a convenient alternative to manually dragging the pane's border:
Click the
 icon at the top right of the pane to instantly maximize its size.
Click the
 icon to return the pane to its original width.